R Weekly 2017-25 Plain Text, New dplyr, Spaces Tabs
Highlight
-
dplyr 0.7.0 - tidy evaluation, character encoding, new datasets, new & improved verbs and over 100 improvements and bug fixes.
-
Developers Who Use Spaces Make More Money Than Those Who Use Tabs
Insights
R in the Real World

-
Looking at US History using tidytext: Inaugural Speech Analysis Part 2
-
Stats NZ encouraging active sharing for microdata access projects
-
papr - rate papers on biorxiv in a single swipe and help science!
R in Academia
Videos and Podcasts
R in Organizations
-
Syberia - A development framework for R code in production
Resources
New Packages
-
ari - The automated R instructor
-
aargh - Easily Expose R Functions to Command Line Arguments
-
baseballDBR - A tool to gather and analyze data from the Baseball Databank.
Package Releases
-
dplyr 0.7.0 - A grammar of data manipulation
-
interp 1.0-27 - Bivariate data interpolation on regular and irregular grids, either linear or using splines
-
RcppMsgPack 0.1.1 - RcppMspPack provides R with MessagePack header files.
-
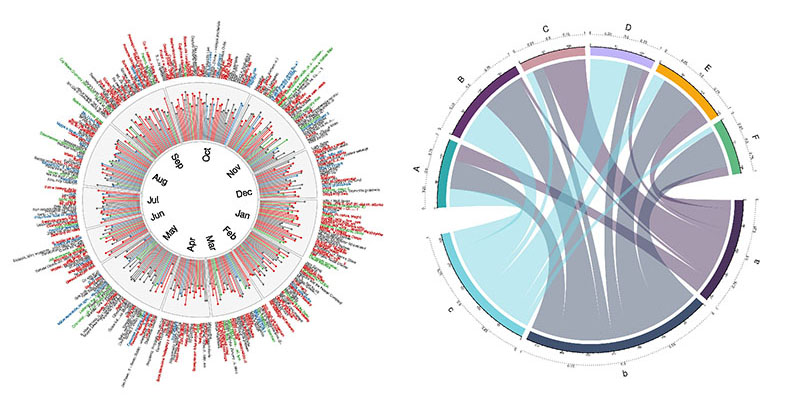
circlize 0.4.0 - circular visualization in R

-
ashr 2.1-21 - Methods for Adaptive Shrinkage, using Empirical Bayes
-
ggsci 2.7 - Scientific journal and sci-fi themed color palettes for ggplot2. New color palettes from JAMA, Tron Legacy, and Material Design.

R Internationally
Tutorials

-
Generating publication-ready sequence logos in R using ggseqlogo
-
How to Write Pelican Blog Posts using RMarkdown & Knitr, 2.0
-
Data Science for Business - Time Series Forecasting Part 3: Forecasting with Facebook’s Prophet
-
Facilitating Exploratory Data Visualization: Application to TCGA Genomic Data
-
“smooth” package for R. Common ground. Part I. Prediction intervals

-
Facilitating Exploratory Data Visualization: Application to TCGA Genomic Data
-
Data Science for Business - Time Series Forecasting Part 3: Forecasting with Facebook’s Prophet
-
How to Write Pelican Blog Posts using RMarkdown & Knitr, 2.0
-
How to draw connecting routes on map with R and great circles
R Project Updates
Updates from R Core:
-
parse()no longer gives spurious warnings when extracting srcrefs from a file not encoded in the current locale. -
New function
isFALSE()defined analogously toisTRUE(). -
factor()now usesorder()to sort its levels, notsort.list(). This makesfactor()support custom vector-like objects if methods for the appropriate generics are defined. This change has the side effect of makingfactor()succeed on empty or length-one non-atomic vector(-like) types (e.g., list), where it failed before. -
fourfoldplot()could encounter integer overflow when calculating odds ratio. -
factor()and hencedroplevels()now keepattributes.
Upcoming Events
-
angletR 2017 June 28 - 30, 2017
angletR aims to provide a national forum to exchange and share ideas on the use of R in different subjects such as visualisation, applied statistics, biostatistics and bioinformatics, Bayesian statistics, data analysis, Big Data, modelling, machine learning, high performance computing, etc. -
useR! 2017 July 4, 2017
The annual useR! conference is the main meeting of the international R user and developer community.
More past events at R conferences & meetups.
Quotes of the Week
New blog post: "Developers who use spaces make more money than those who use tabs" https://t.co/mLHlDrbEBm #rstats pic.twitter.com/nCP1rJ0B5s
— David Robinson (@drob) 15 June 2017
If you like Datasaurus, remember the lesson of "O RLY?" owl- don't skip plotting your residuals 🙈https://t.co/pGtXugYUvs #rstats pic.twitter.com/aq8uXArV8p
— Alison Hill (@apreshill) 13 June 2017
XMin is a truly minimalistic and fast theme made by @xieyihui - ca. 150 LOC in total, including HTML and CSS https://t.co/Q4febO7Kyn
— GoHugo.io (@GoHugoIO) June 16, 2017
When I was coding in my hobby room in The Hague, I never thought it would be used so far away, to such a good purpose. #rstats #foss pic.twitter.com/DQ9kto7bdQ
— Mark van der Loo (@markvdloo) June 11, 2017