R Weekly 2019-01 pagedown, reticulate, gganimate
Highlight
-
pagedown - Create Paged HTML Documents for Printing from R Markdown
-
R or Python? Why not both? Using Anaconda Python within R with {reticulate}
Insights
-
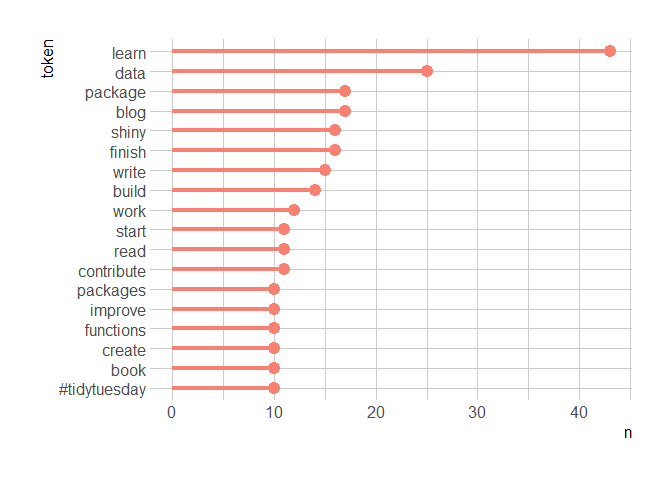
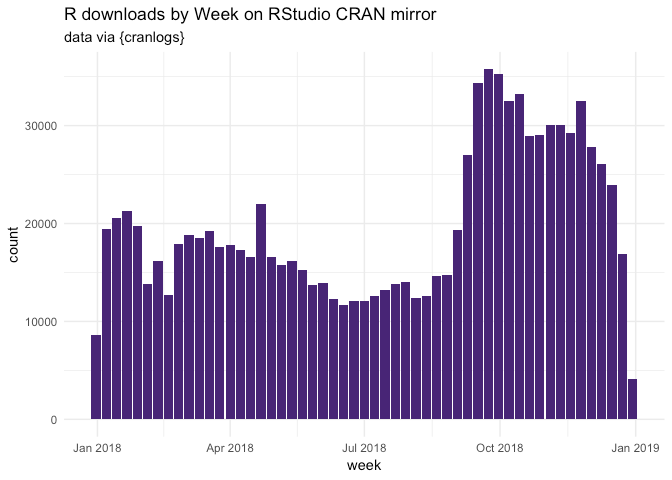
Here’s why 2019 is a great year to start with R - A story of 10 year old R code then and now
-
R or Python? Why not both? Using Anaconda Python within R with {reticulate}
R in the Real World
-
Are men and women tweeted equal? a corpus linguistic approach in R
-
Using R to download missing photos from JSON files after incorrect Google Takeout.
-
Looking into 19th century ads from a Luxembourguish newspaper with R
Resources
-
pagedown - Create Paged HTML Documents for Printing from R Markdown
New Packages
CRAN
- nycgeo - New package for NYC spatial data
-
RcppDynProg - table-based dynamic programming
-
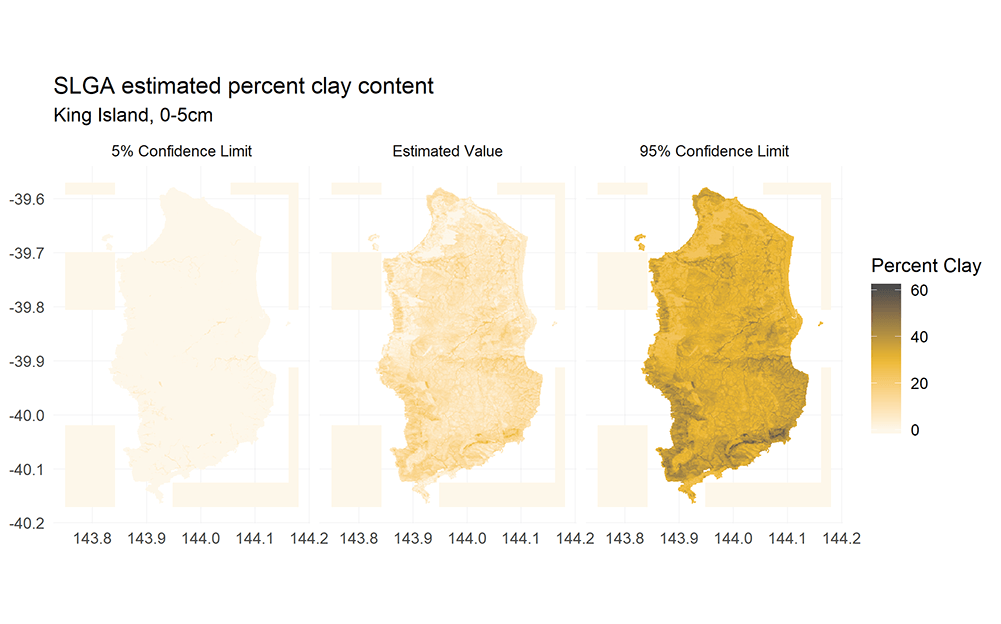
slga - soils data for the people
Updated Packages
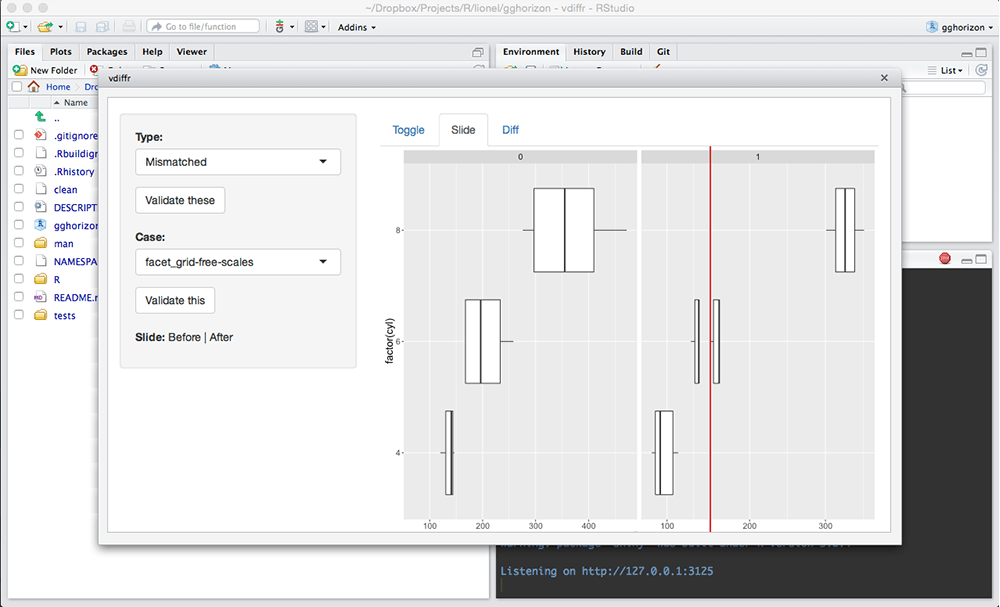
- vdiffr 0.3.0 - Visual unit tests for R plots
-
haven 2.0.0 - read and write various data formats used by other statistical packages
-
Apache Drill 1.15.0 + sergeant 0.8.0 = pcapng Support, Proper Column Types & Mounds of New Metadata
Tutorials
-
Example adding Firebase authentication to a Shiny application
-
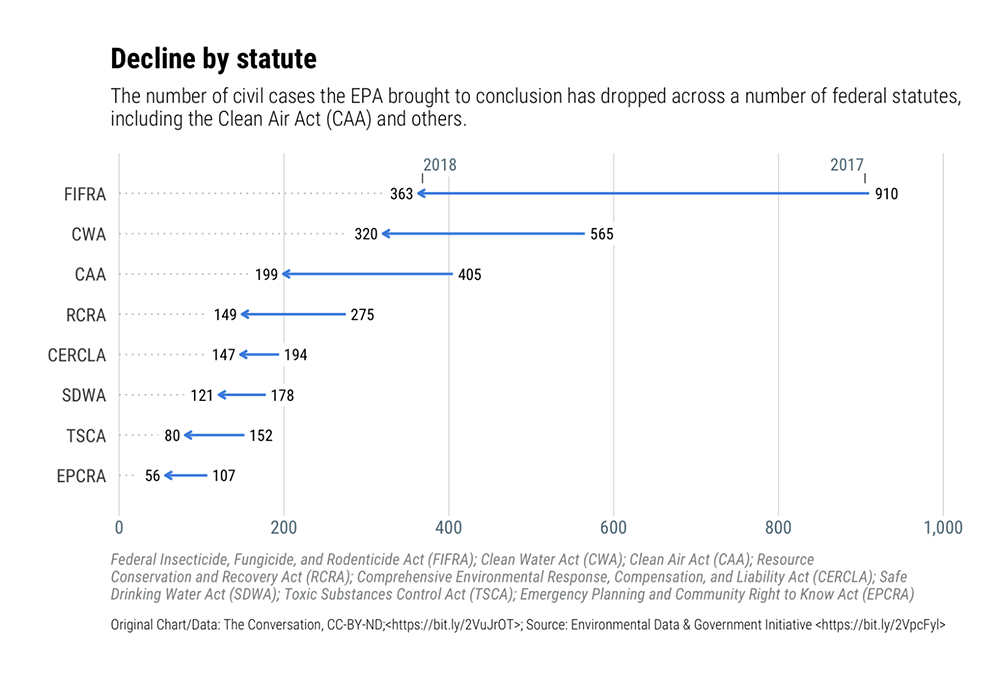
‘data:’ Scraping & Chart Reproduction : Arrows of Environmental Destruction
Upcoming Events in 3 Months
Events in 3 Months:
More past events at R conferences & meetups.
Call for Participation
Quotes of the Week
Back to work after the holidays and spending my time figuring out how to decompose variance visually in multilevel models. Here is a way to see the "flow" of variance. Thanks to the riverplot package in #R #Rstats #dataviz. pic.twitter.com/JM8QNG2CRj
— Matt Barstead (@MGB_Research) January 4, 2019
📊 If you spend a lot of time playing w/ ggplot2, this is quite entertaining…
— Mara Averick (@dataandme) January 4, 2019
"Mapping ggplot geoms and aesthetic parameters" ✍️ @yihanwu5https://t.co/joCrOMYPPZ #rstats #dataviz pic.twitter.com/YFI5EDgGOk