R Weekly 2019-17 R 3.6.0, Shiny, Production
Highlight
-
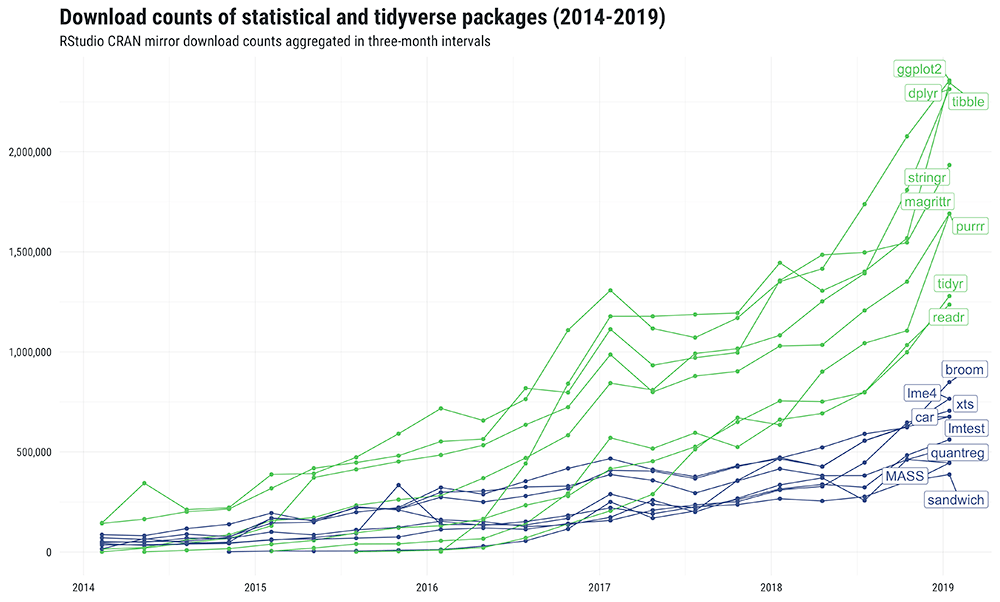
DataCamp CEO steps down indefinitely in wake of ‘inappropriate behavior’
-
Shiny v1.3.2 - Visually debug your reactivity issues
Videos and Podcasts
- Shiny Developer Series Episode 0: Launch! - In this episode, host Eric Nantz shares his journey with Shiny and plans for future content, along with a demo of the
shinyhelperpackage to enhance in-app documentation with markdown.
Insights

R in the Real World
-
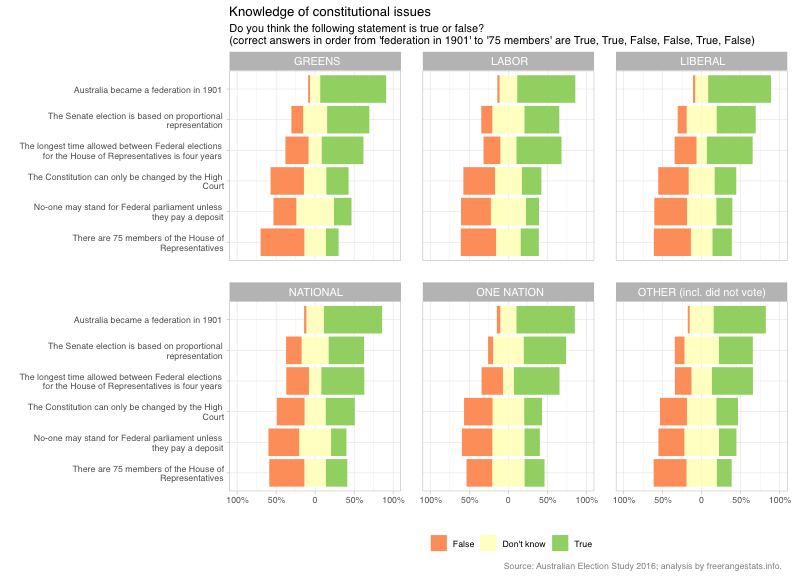
Data-driven design in Curious City: In, Out, Above, Beyond Saint Paul
-
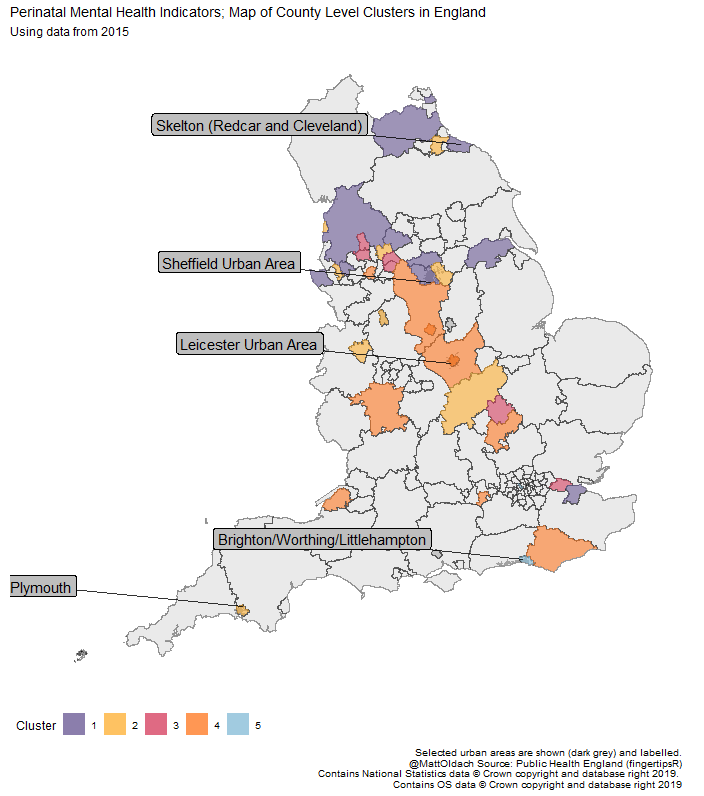
Identifying regional differences of Perinatal Mental Health indicators in the UK with R

-
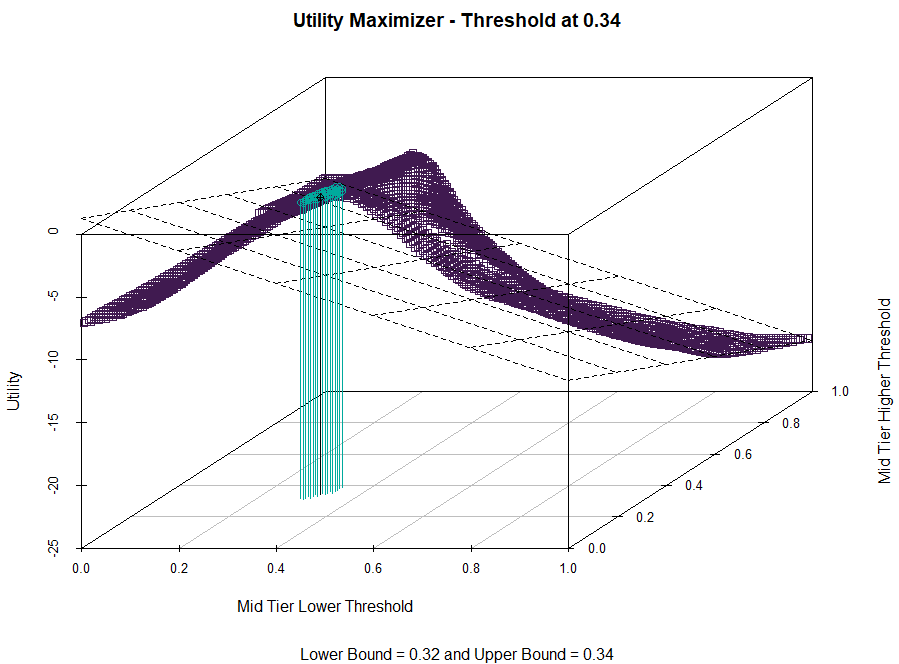
Companies Are Demanding Model Interpretability. Here’s How to Do It Right.
-
How to easily automate R analysis, modeling and development work using CI/CD, with working examples

Resources
New Packages
CRAN
GitHub or Bitbucket
- ggreverse - turning ggplots back in to code
Updated Packages
-
corrr 0.3.2 - Correlations in R
-
janitor 1.2.0 - Simple Tools for Examining and Cleaning Dirty Data
-
mlr 2.14.0 - Machine Learning in R
-
Shiny v1.3.2 - Visually debug your reactivity issues

- modelplotr v1.0 - Visualize the Business Value of your Predictive Models
R Internationally
Tutorials

-
Create R Markdown reports and presentations even better with these 3 practical tips
-
Describe and understand Bayesian models and posteriors using bayestestR
-
Creating blazing fast pivot tables from R with data.table - now with subtotals using grouping sets
-
Every possible scatterplot from a data.frame (32 thousand plots of mtcars)
R Project Updates
Updates from R Core:
Upcoming Events in 3 Months
Events in 3 Months:
More past events at R conferences & meetups.
Call for Participation
Quotes of the Week
#rstats 3.6.0 "Planting of a Tree" is released (source version)
— Peter Dalgaard (@pdalgd) April 26, 2019
New cheatsheet today! Use #python and #rstats together with #reticulate! Available at https://t.co/OZVUTm5lDl @rstudio pic.twitter.com/RUlXozso7U
— Garrett Grolemund (@StatGarrett) April 26, 2019
🤓 So many handy details covered in @ClausWilke's new book.
— Mara Averick (@dataandme) April 22, 2019
📖 "Fundamentals of Data Visualization"
🆓 online: https://t.co/zYvbBoaBJI #dataviz
📊 #rstats source code: https://t.co/l8X7uIxaJt (book language-agnostic) pic.twitter.com/Z5HNbMIyYg