R Weekly 2020-04 Geographic distance, mutable feeling objects, Github Actions
Release Date: 2020-01-27
This week’s release was curated by Jonathan Carroll, with help from the RWeekly team members and contributors.
Highlight

Insights
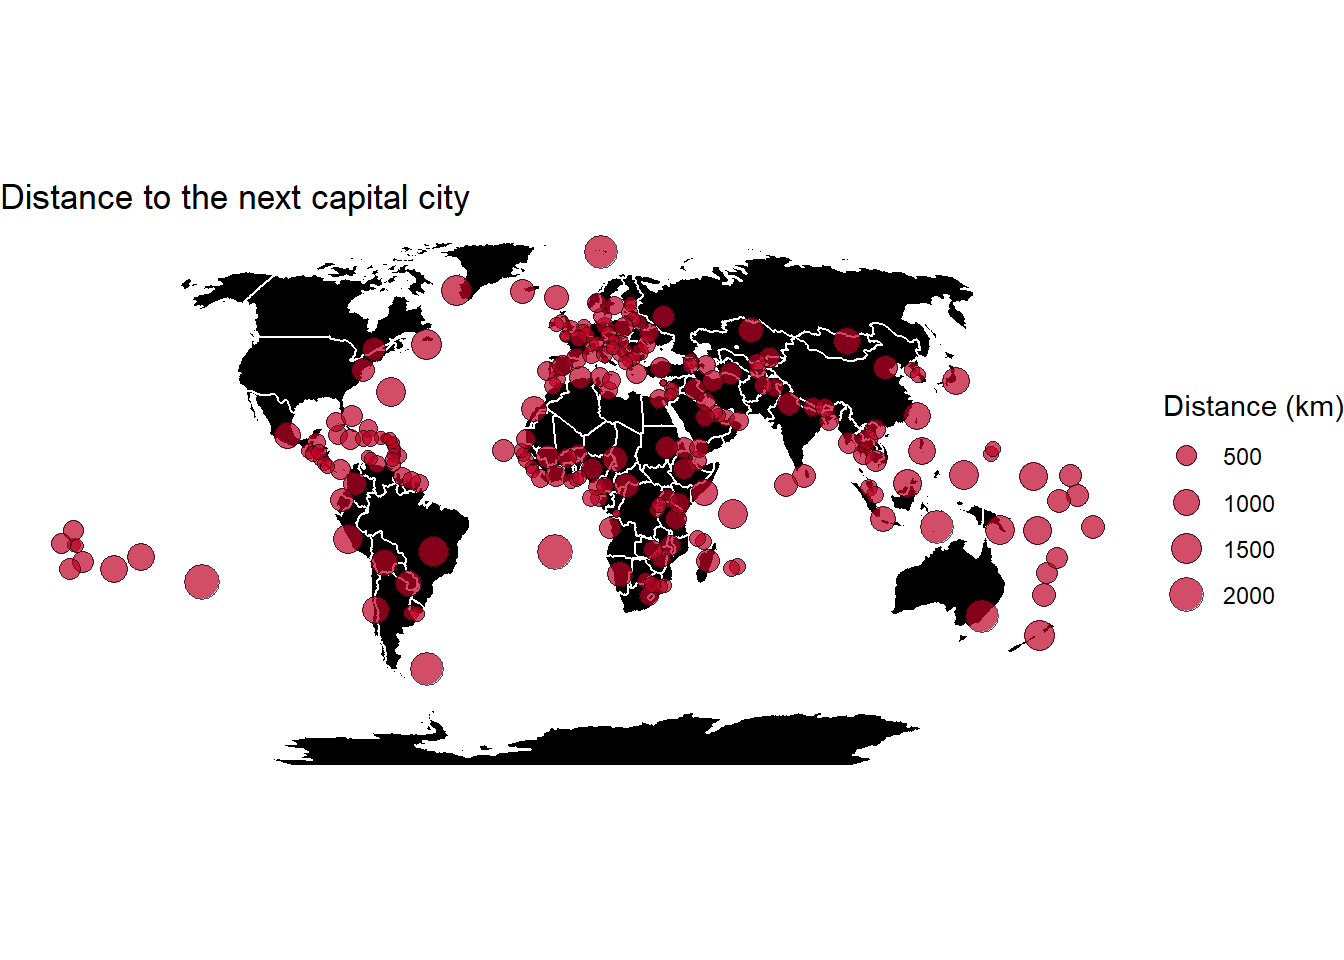
- Geographic distance
- Easily align ggplot2 titles, subtitles, and footnotes
- Create a second legend to bookend the top and bottom of a plot in ggplot2
- Three vectorised simulation approaches to the “Monty Hall Problem” using base R, data.table and tidyverse.
- Shiny dashboards using the googleAnalyticsR package!
- Exploring the Curse of Dimensionality - Part II.
- December 2019: “Top 40” New R Packages
- unpack Your Values in R
- Using unpack to Manage Your R Environment
- Why we wrote wrapr to/unpack
- Objects that feel mutable in R
- Generate synthetic data using R
- RStudio Projects and Working Directories: A Beginner’s Guide
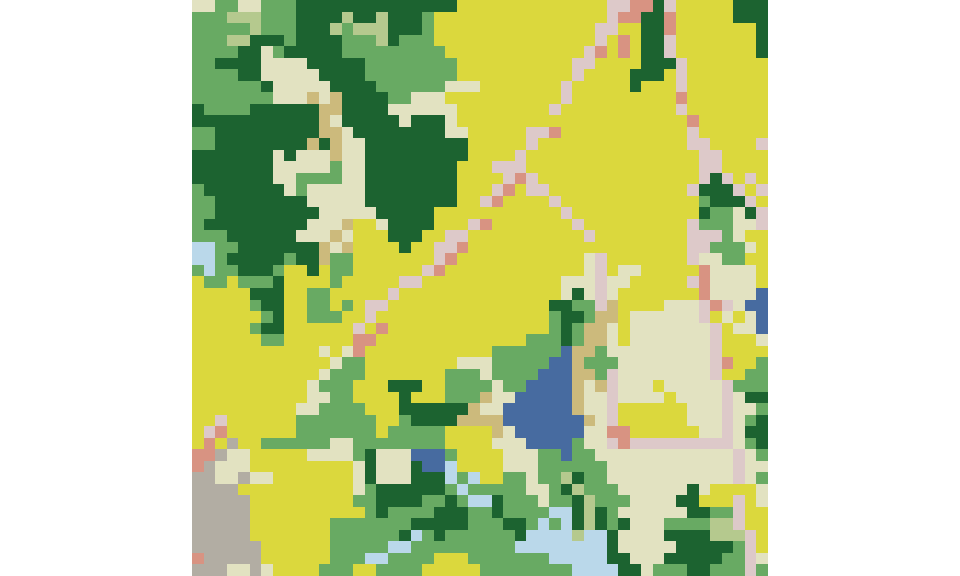
- How to calculate landscape metrics for local landscapes?

- A brief account (via simulation) of the ROC (and its AUC)
- Calculating the Required Sample Size for a Binomial Test in R
- Explanatory Model Analysis with modelStudio
- Factors in R
Resources
New Packages
CRAN
- {heddlr} 0.5.0: Bring a functional programming mindset to R Markdown document generation
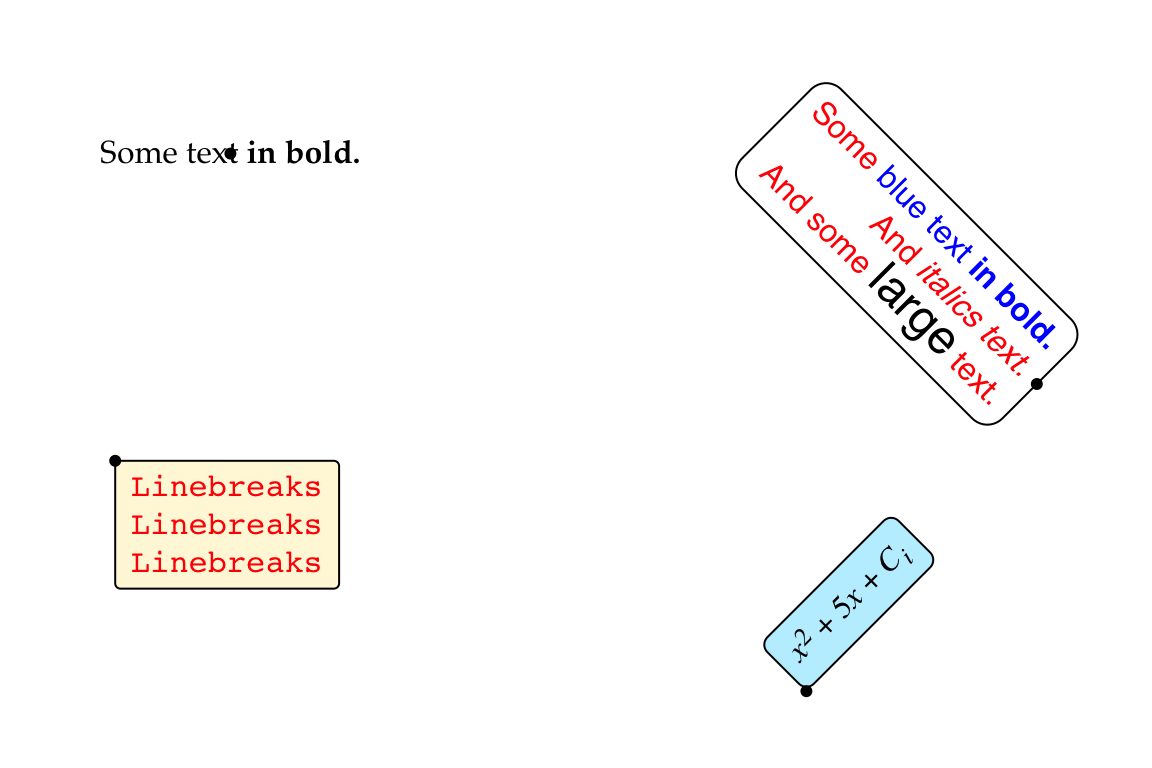
- {gridtext} 0.1.0: Improved Text Rendering Support for ‘Grid’ Graphics

- {santoku} 0.3.0: A Versatile Cutting Tool
- {round} 0.12-1: Rounding to Decimal Digits
- {progressr} 0.4.0: A Unifying API for Progress Updates
- {fitzRoy} 0.3.1: Easily Scrape and Process AFL Data
GitHub or Bitbucket
Updated Packages
- {bomrang} 0.7.0: Australian Government Bureau of Meteorology (‘BOM’) Data Client
- {GSODR} 0.2.1: Global Surface Summary of the Day (‘GSOD’) Weather Data Client
- {vctrs} 0.2.2: Vector Helpers
- {tidyr} 1.0.2: Tidy Messy Data
- {rlang} 0.4.3: Functions for Base Types and Core R and ‘Tidyverse’ Features
- {charlatan} 0.4.0: Make Fake Data
- {magick} 2.3: Advanced Graphics and Image-Processing in R
- {gh} 1.1.0: ‘GitHub’ ‘API’
- {dtplyr} 1.0.1; Data Table BackEnd for ‘dplyr’
- {janitor} 1.2.1: Simple Tools for Examining and Cleaning Dirty Data
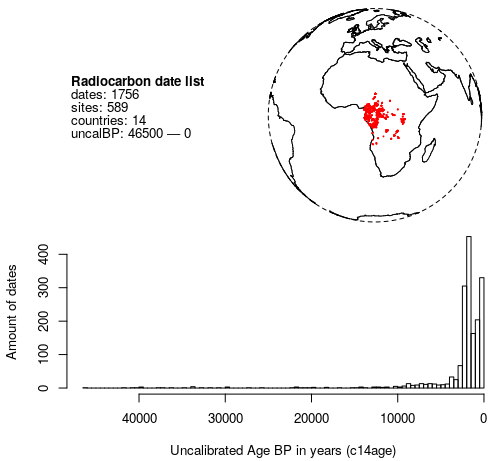
- {c14bazAAR} 1.2.0: Download and Prepare C14 Dates from Different Source Databases

- {threejs} 0.3.3: Interactive 3D Scatter Plots, Networks and Globes
- {survey} 3.37: Analysis of Complex Survey Samples
- {RcppArmadillo} 0.9.800.4.0: ‘Rcpp’ Integration for the ‘Armadillo’ Templated Linear Algebra Library
- {anytime} 0.3.7: Anything to ‘POSIXct’ or ‘Date’ Converter
- {RPushbullet} 0.3.3: R Interface to the Pushbullet Messaging Service
- {RStudio Connect} 1.8.0
R Internationally
Tutorials
- Embedding Matrix on Tabular Data
- RStudio Projects and Working Directories: A Beginner’s Guide
- A simple example of interacting existing VBA scripts with R/Python.
- How to Remove Outliers in R
- Explainable AI (XAI)… Explained! Or How to whiten any Black Box with LIME
- Deploy your bookdown project to Netlify with Github Actions
R Project Updates
Updates from R Core:
Upcoming Events in 3 Months
Events in 3 Months:
-
Thinking about rstudio::conf 2020? See the full conference schedule!
-
LondonR & R-Ladies to host ‘watch party’ at RStudio Conference, Jan 29th
-
satRday Newcastle upon Tyne, April the 4th, Call for speakers for #satRdayNCL closes 31st Jan.
More past events at R conferences & meetups.
Datasets
Call for Participation
Quotes of the Week
Little #rstats tip: While you can easily toggle the display of R code with `code_folding` in #rmarkdown, it's less easy to toggle the *output* of your code. Though there's a (relatively) straightforward way to do this using the beauty of `html_tabsets`. Here's a quick demo! pic.twitter.com/FP7JGsNVaV
— Brendan Cullen (@_bcullen) January 20, 2020
#RStats essential changes for R 4.0.0: since matrices are soon going to have class() of both 'matrix' & 'array', you should really update any logical tests from:
— mikefc (@coolbutuseless) January 25, 2020
class(X)=='foo'
To:
inherits(X, 'foo')#rstatsmemes pic.twitter.com/hSICMhSh0s