R Weekly 2020-45 Web SVG graphics device, markdown powered ggplot themes, playing Midi
Release Date: 2020-06-22
This week’s release was curated by Miles McBain, with help from the RWeekly team members and contributors.
Highlight
Insights
-
NWSL Mini-Previews: OL Reign, Portland Thorns, and Utah Royals FC
-
Bioconductor submissions: How long does it take? And what to expect
-
Implementing supervised discretization step with XgBoost backend for {tidymodels}
-
From R Hub – Counting and Visualizing CRAN Downloads with packageRank (with Caveats!)
-
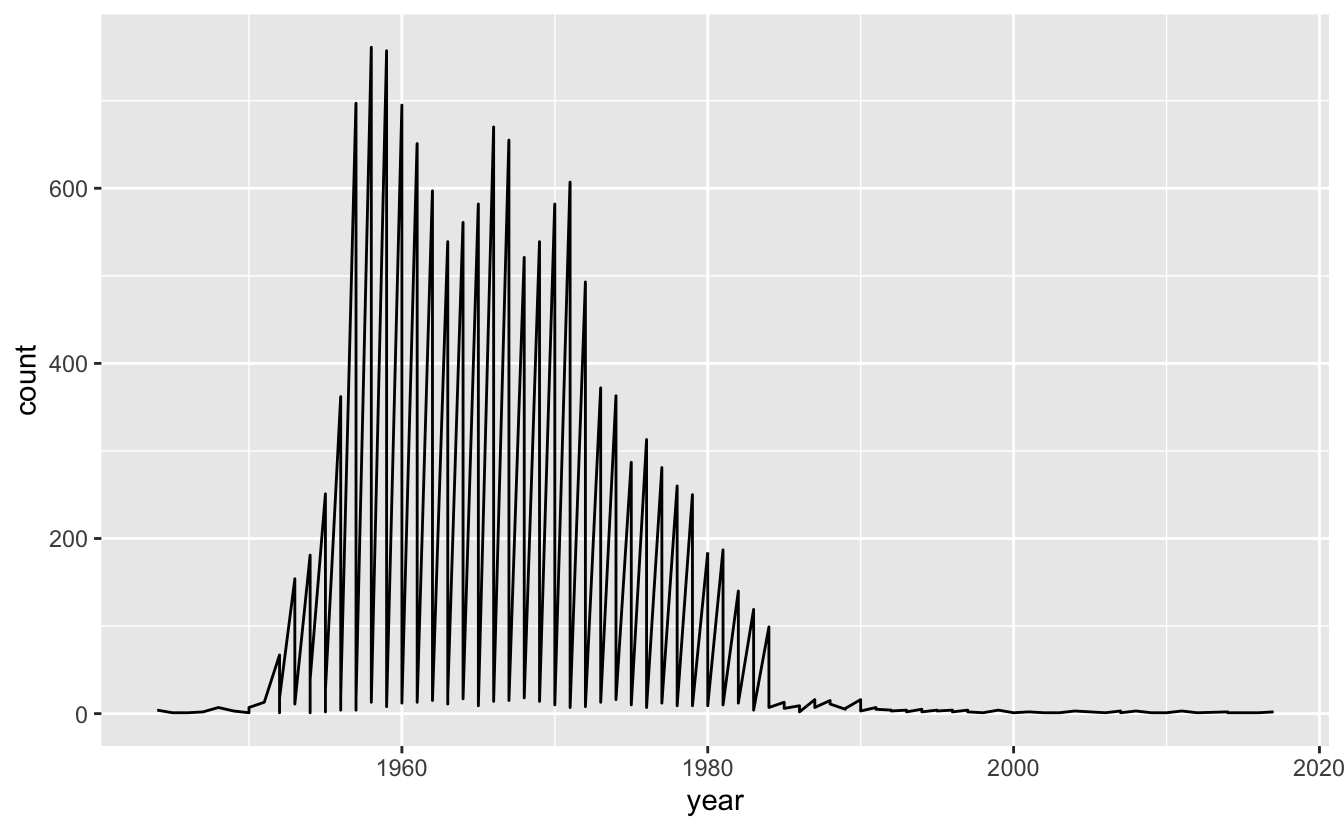
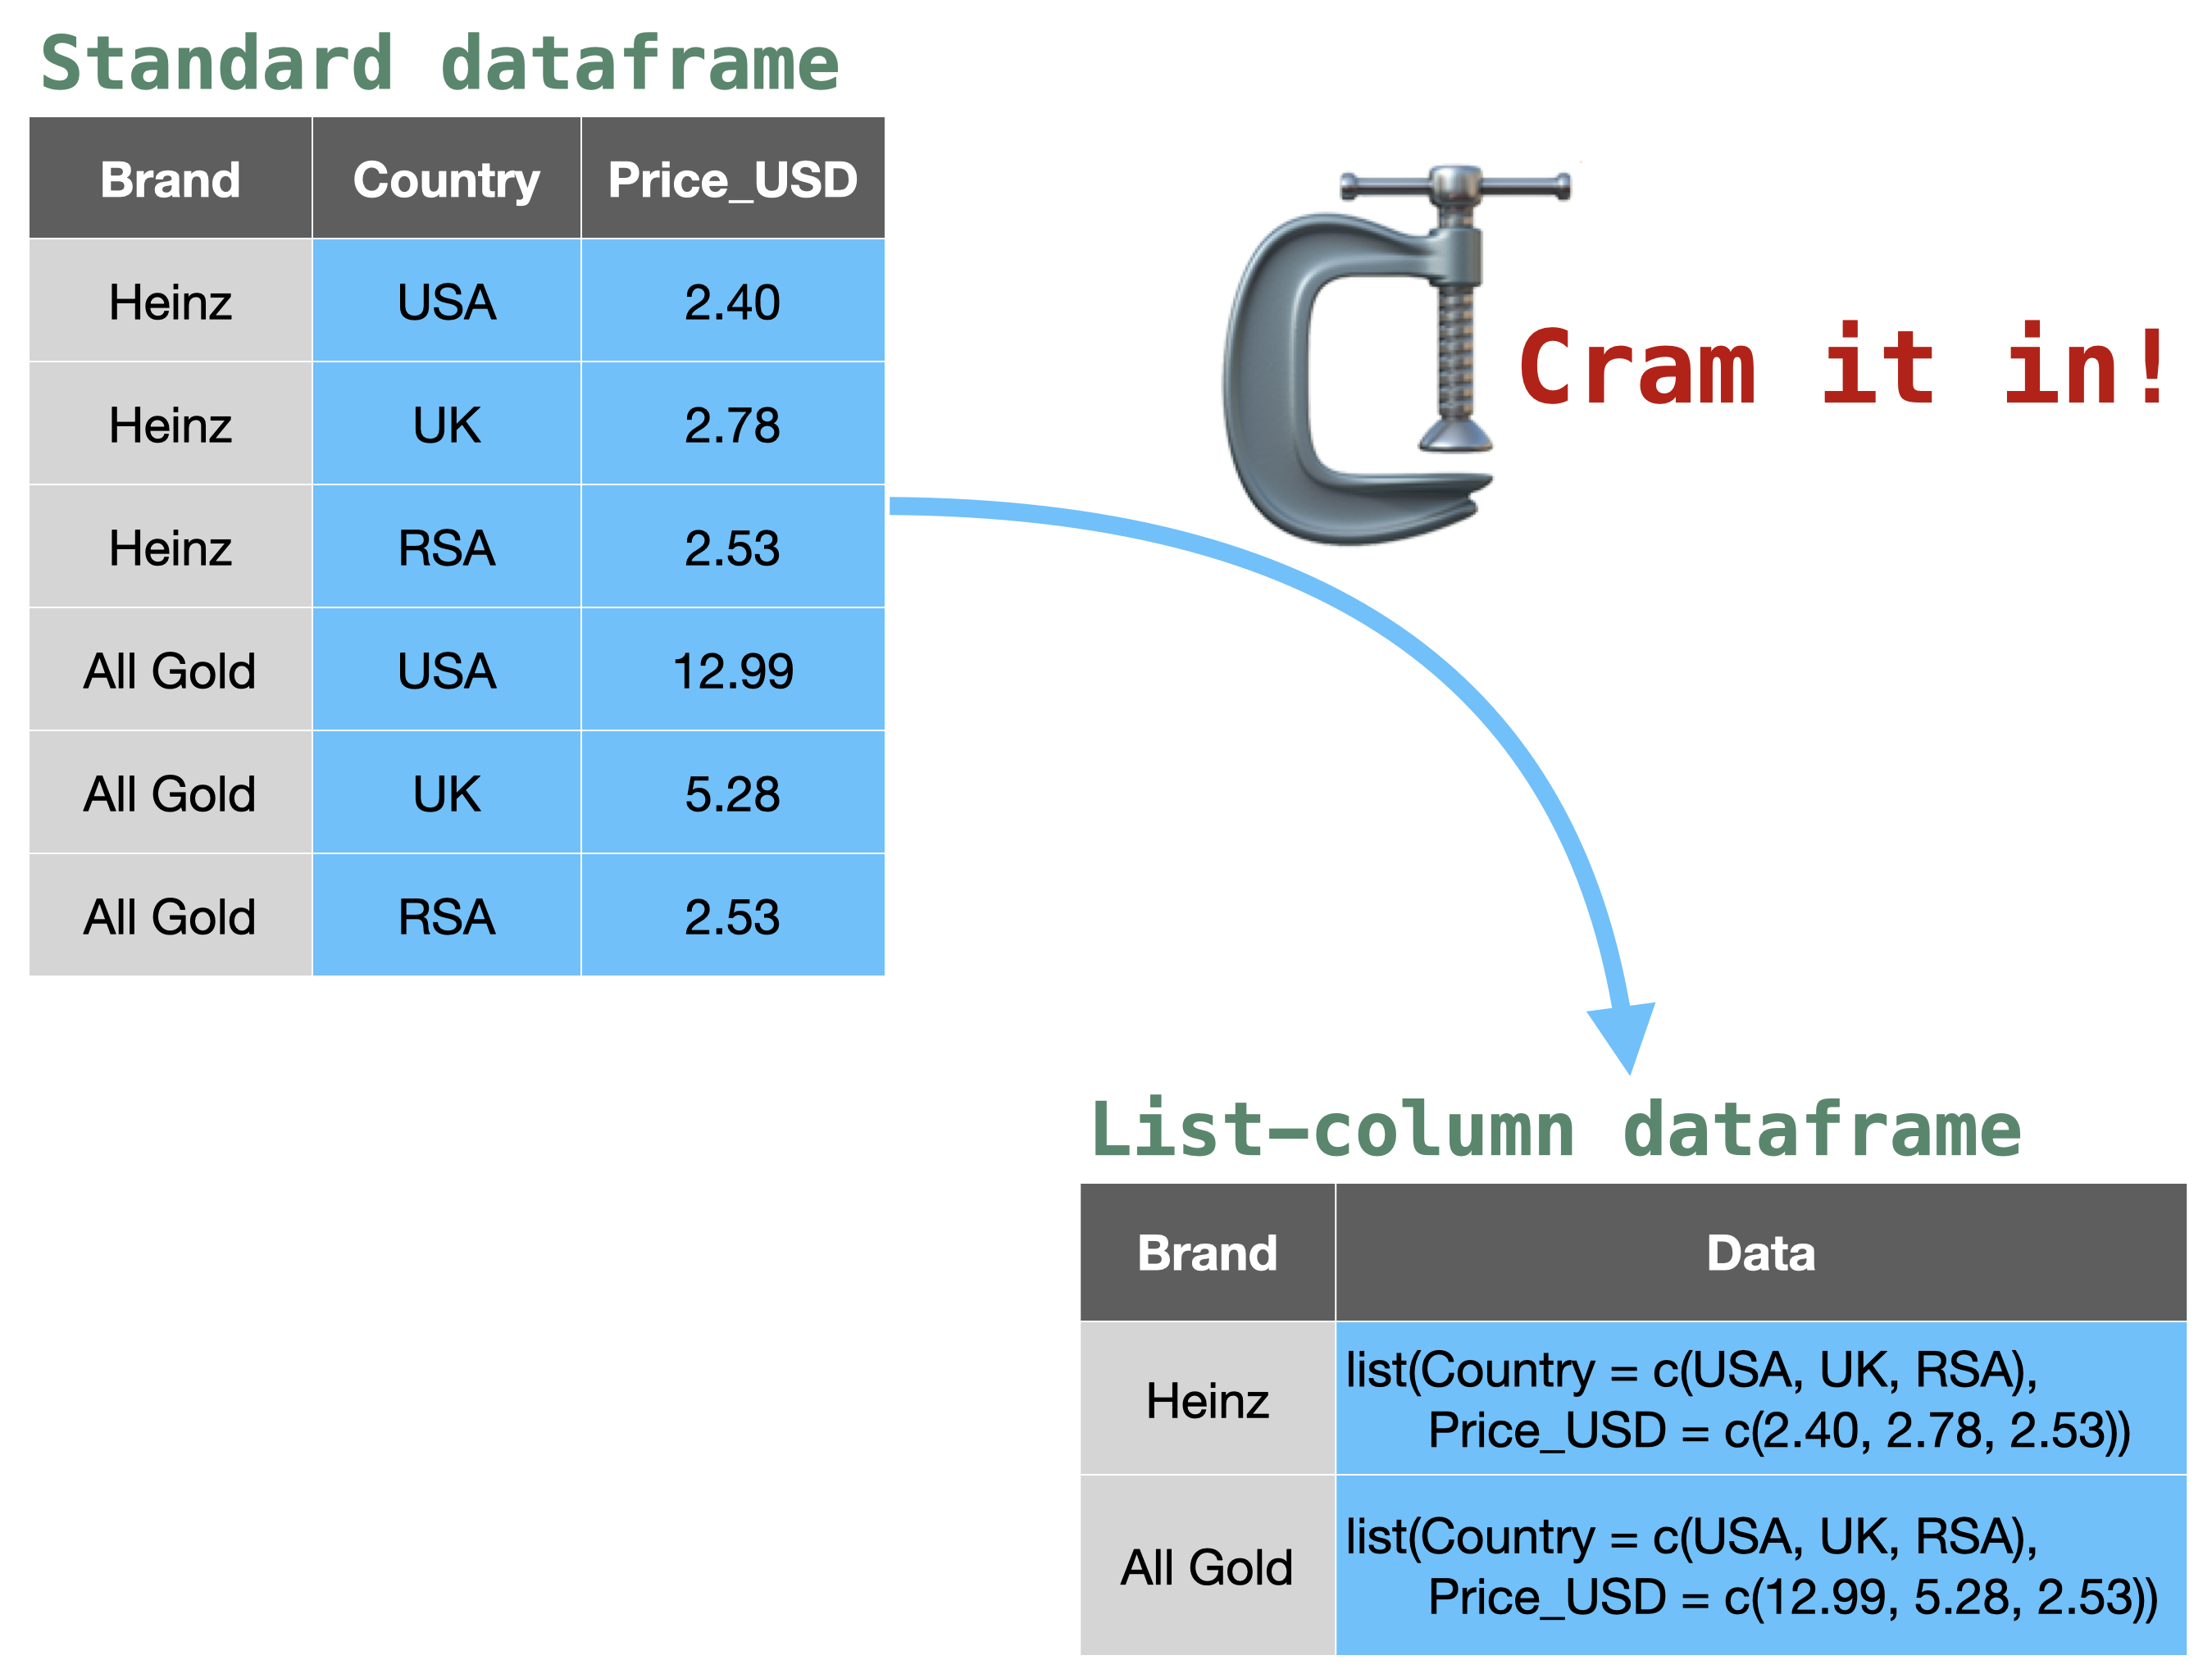
Neat and tidy data exploration with list-columns and purrr - 6/21/2020
R in the Real World
R in Academia
Resources
New Packages
CRAN
- {glmm} 1.4.2: Generalized Linear Mixed Models via Monte Carlo Likelihood Approximation
-
{FDboost} 0.3-3: Boosting Functional Regression Models
-
{gemtc} 0.8-5: Network Meta-Analysis Using Bayesian Methods
-
{gRim} 0.2.3: Graphical Interaction Models
- {Gammareg} 3.0: Classic Gamma Regression: Joint Modeling of Mean and Shape Parameters
-
{define} 0.2.9: Create FDA-Style Data and Program Definitions
-
{cutpointr} 1.0.32: Determine and Evaluate Optimal Cutpoints in Binary Classification Tasks
-
{BGVAR} 2.0.0: Bayesian Global Vector Autoregressions
-
{tilemaps} 0.1.0: Generate Tile Maps
-
{revulyticsR} 0.0.1: Connect to Your ‘Revulytics’ Data
-
{doc2concrete} 0.4.6: Measuring Concreteness in Natural Language
-
{rLFT} 1.0.0: Processing Linear Features
-
{RcmdrPlugin.BWS1} 0.1-2: R Commander Plug-in for Case 1 (Object Case) Best-Worst Scaling
-
{frechet} 0.1.0: Statistical Analysis for Random Objects and Non-Euclidean Data
-
{CFilt} 0.1.0: Collaborative Filtering by Reference Classes
-
{anomalize} 0.2.1: Tidy Anomaly Detection
-
{JMcmprsk} 0.9.8: Joint Models for Longitudinal and Competing Risks Data
-
{sigmajs} 0.1.5: Interface to ‘Sigma.js’ Graph Visualization Library
-
{yamlet} 0.4.8: Versatile Curation of Table Metadata
-
{regress} 1.3-21: Gaussian Linear Models with Linear Covariance Structure
-
{rbi.helpers} 0.3.2: ‘RBi’ Helper Functions
- {spinifex} 0.2.0: Manual Tours, Manual Control of Dynamic Projections of Numeric Multivariate Data
-
{selac} 1.7.5: Selection Models for Amino Acid and/or Codon Evolution
-
{adjclust} 0.5.99: Adjacency-Constrained Clustering of a Block-Diagonal Similarity Matrix
-
{treeheatr} 0.1.0: Heatmap-Integrated Decision Tree Visualizations
-
{WEGE} 0.1.0: A Metric to Rank Locations for Biodiversity Conservation
-
{loon.ggplot} 1.0.0: Making ‘ggplot2’ Plots Interactive with ‘loon’ and Vice Versa
-
{ggrastr} 0.1.9: Raster Layers for ‘ggplot2’
-
{bibliometrix} 3.0.2: Comprehensive Science Mapping Analysis
-
{VFP} 1.3: Variance Function Program
-
{STB} 0.6.4: Simultaneous Tolerance Bounds
-
{GomoGomonoMi} 0.1.0: Animate Text using the ‘Animate.css’ Library
-
{geodrawr} 1.0.1: Making Geospatial Objects
-
{extras} 0.0.1: Helper Functions for Bayesian Analyses
-
{DysPIAData} 0.1.1: Background and Pathway Data Used in ‘DysPIA’
-
{bcfrailph} 0.1.0: Semiparametric Bivariate Correlated Frailty Model
-
{SMDIC} 0.1.1: Identification of Somatic Mutation-Driven Immune Cells
-
{RSBJson} 1.1.2: Handle R Requests from R Service Bus Applications with JSON Payloads
-
{docinfeR} 2020.1.0: Automatic Reporter for Inference Analysis
-
{docdescriptR} 2020.1.0: Automatic Reporter for Descriptive Analysis
-
{quint} 2.1.0: Qualitative Interaction Trees
-
{huxtable} 5.0.0: Easily Create and Style Tables for LaTeX, HTML and Other Formats
-
{brm} 1.1.1: Binary Regression Model
- {mds} 0.3.2: Medical Devices Surveillance
GitHub or Bitbucket
Updated Packages
Videos and Podcasts
-
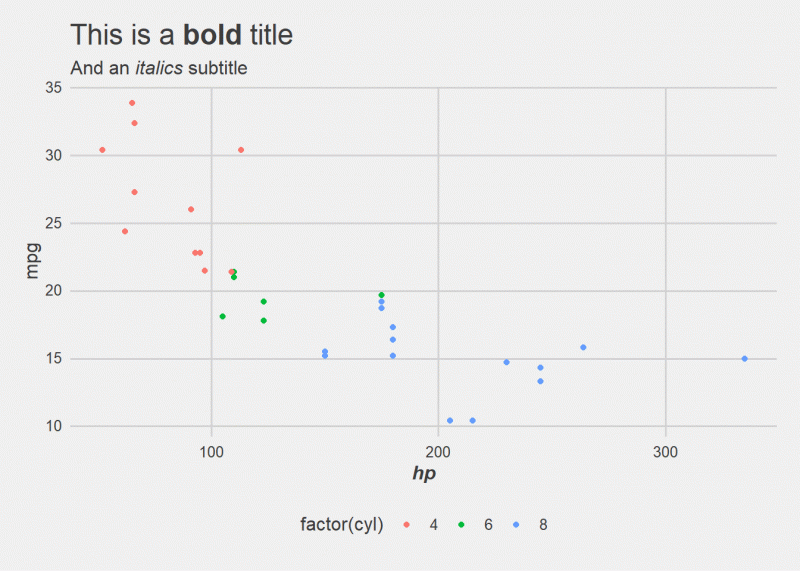
ggplot2 Text Customization with ggtext - Data Visualization in R
-
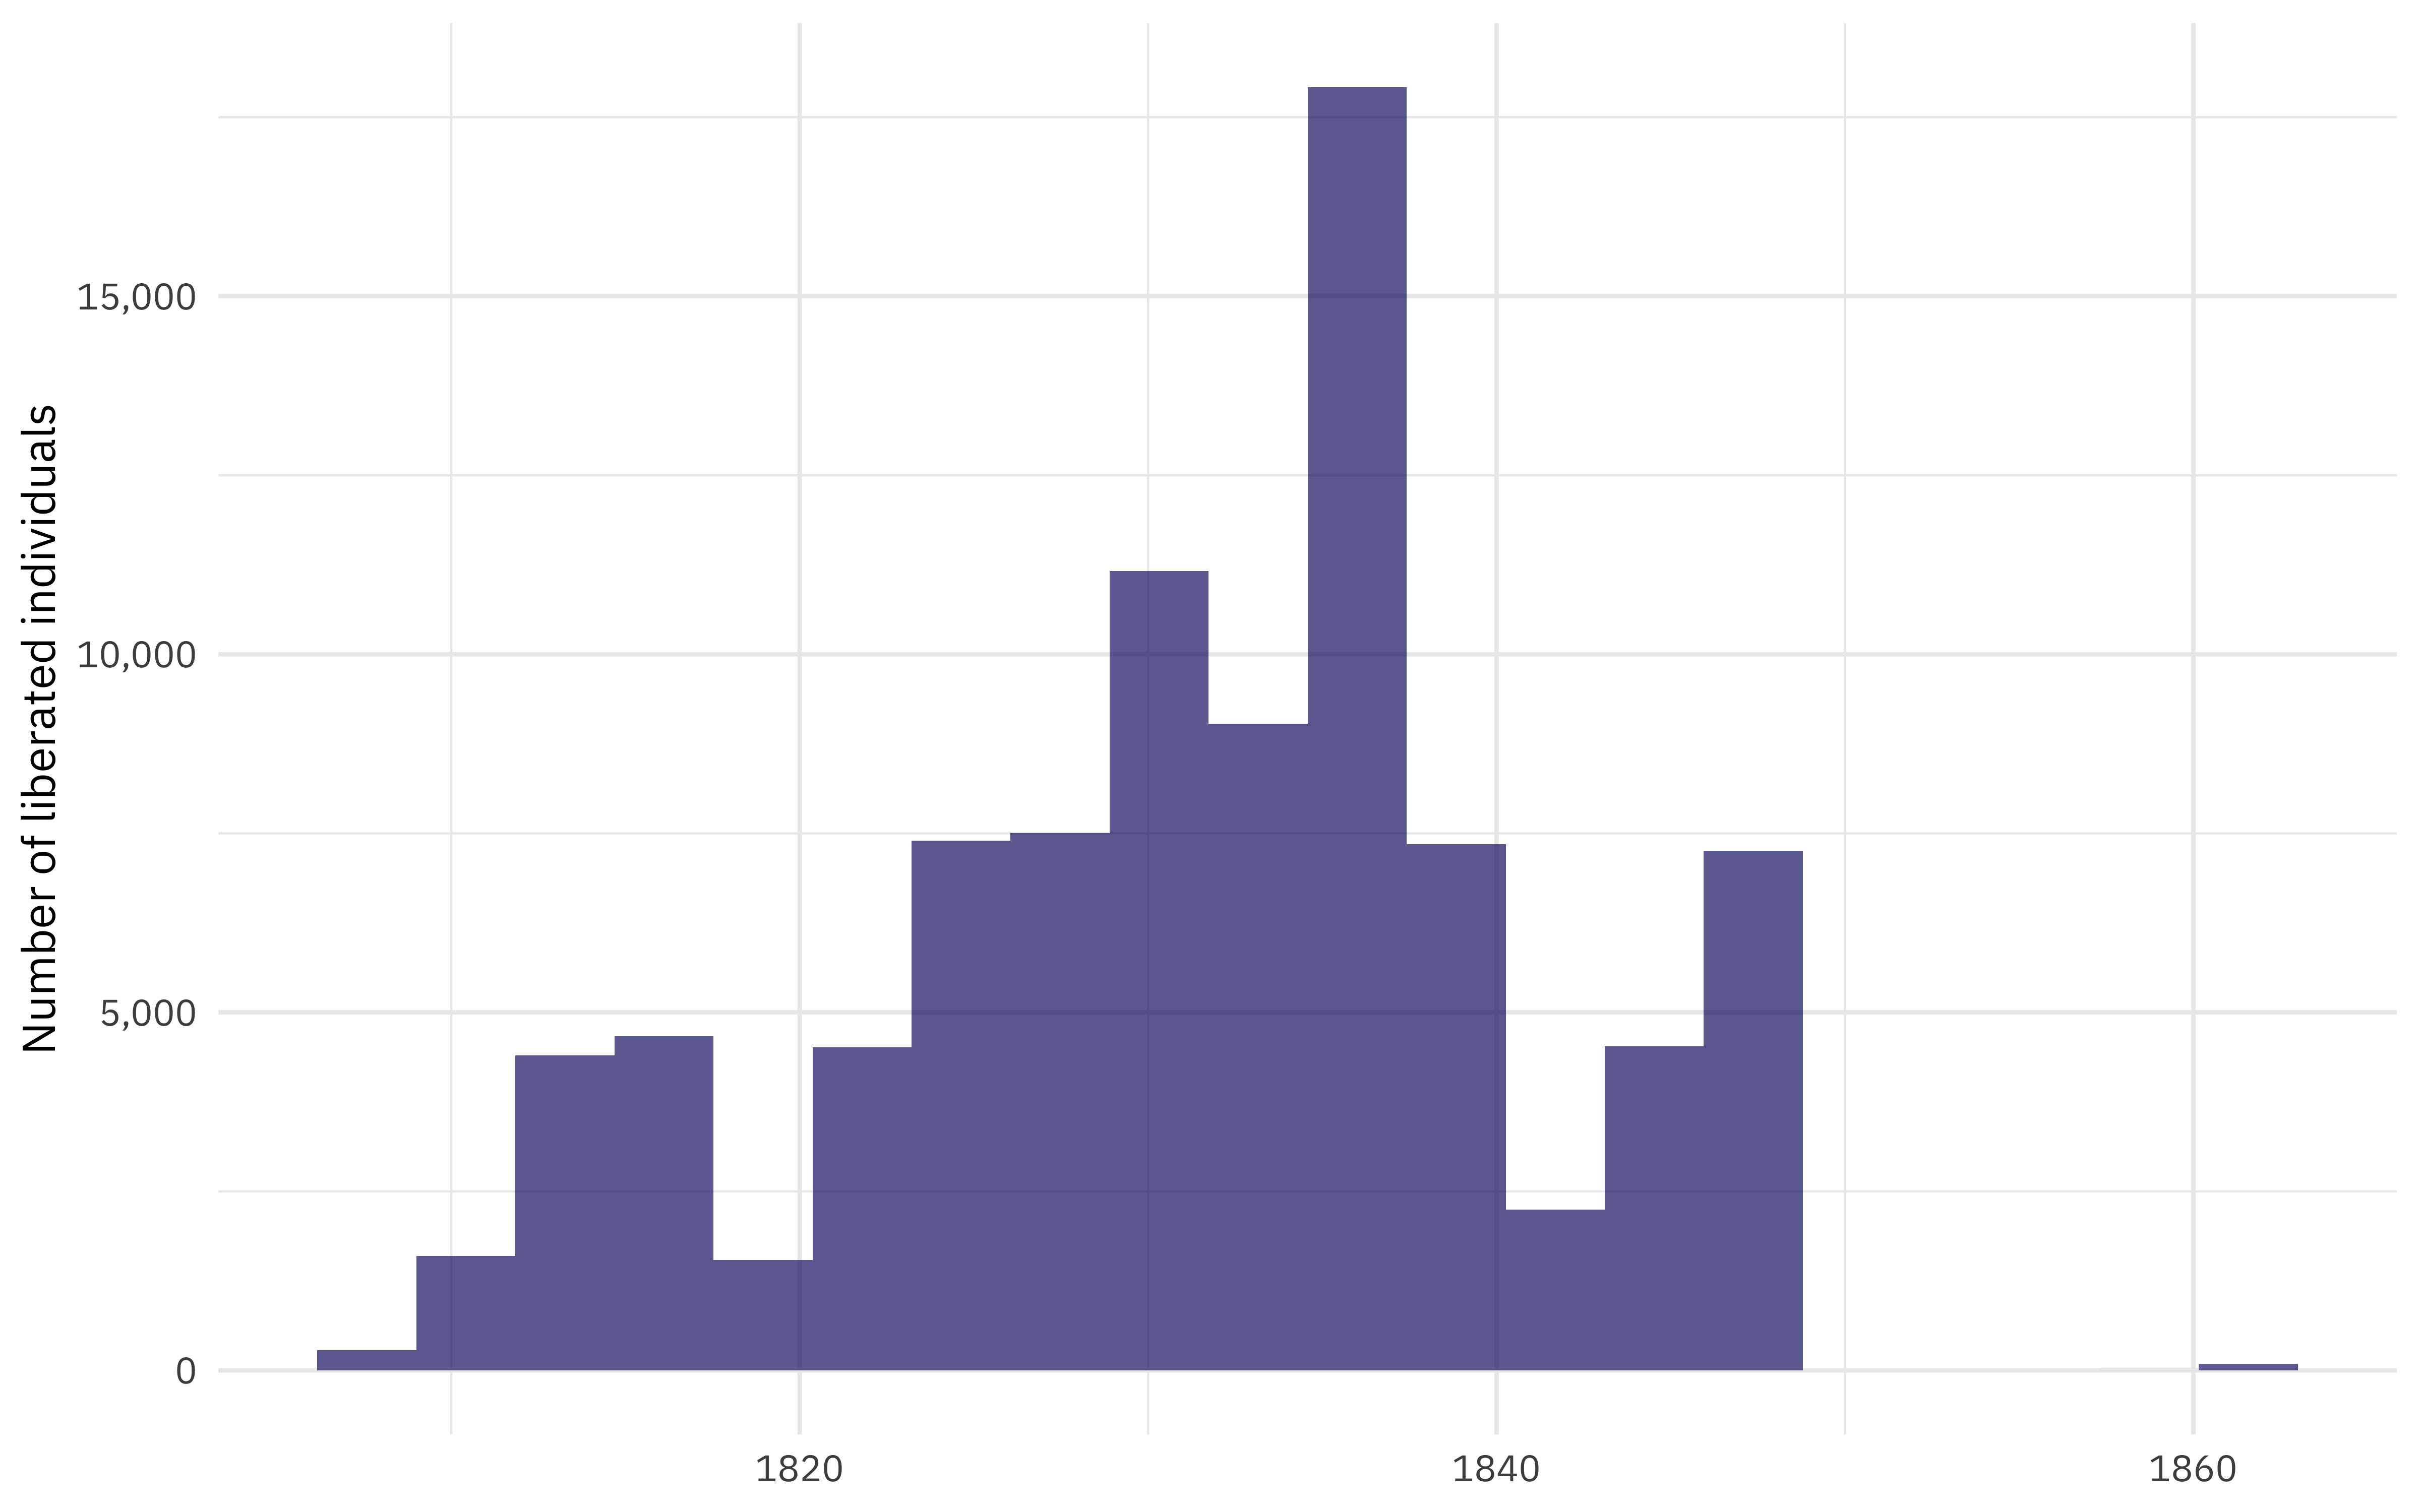
Impute missing data for #TidyTuesday voyages of captive Africans with tidymodels
R Internationally
Tutorials
Upcoming Events in 3 Months
Events in 3 Months:
Jobs
Call for Participation
Quotes of the Week
I realize I'm probably the last horse crossing the finish line here but... can we talk about with() and pipe-unfriendly functions???
— Kelly Bodwin (@KellyBodwin) June 16, 2020
mtcars %>%
with(lm(mpg ~ hp)) %>%
summary()
Soooo satisfying! 🤩#rstats
Inspired by @_ColinFay, I made a 30-day workout #shiny app based on my @orangetheory workout logs posted on @github.
— Zhi Yang, PhD (@zhiiiyang) June 19, 2020
- 📱shinyMobile: Shiny package using #Framework7 by @divadnojnarg
- 📊echarts4r: interactive #dataviz package by @jdatap
- ⏲️waiter: Loading screens by @jdatap pic.twitter.com/Mmem49nzmt
Hi #Rstats,#ggplot2 #rspatial twitter. Want to quickly get colors for your plots and maps? I use palette_explorer() by Martijn Tennekes. With this function you call an awesome shiny app that lets you choose colors for different cases and provides the corresponding code. Outtake: pic.twitter.com/9RkdI8CKb7
— Tobias Stalder (@toeb18) June 16, 2020