R Weekly 2020-32 shinykeyboard, TidyX, Twitter community
Release Date: 2020-08-10
This week’s release was curated by Eric Nantz, with help from the RWeekly team members and contributors.
Highlight
-
shinykeyboard- R package to create an on-screen keyboard as a custom Shiny input binding -
A guide for helping R programmers get involved in the wonderful Twitter community!
Insights
R in the Real World
R in Organizations
Resources
New Packages
CRAN
-
{qpmadr} 0.1.0: Efficient quadratic programming solver with linear inequality, equality and box constraints
-
{fabricerin} 0.1.1: Create Easily Canvas in ‘shiny’ and ‘RMarkdown’ Documents
-
{tboot} 0.2.0: Tilted Bootstrap
-
{chunkhooks} 0.0.1: Chunk Hooks for ‘R Markdown’
-
{eyeRead} 0.0.4: Prepare/Analyse Eye Tracking Data for Reading
-
{mosqcontrol} 0.1.0: Mosquito Control Resource Optimization
-
{starschemar} 1.0.0: Obtaining Star Schemas from Flat Tables
-
{torch} 0.0.1: Tensors and Neural Networks with ‘GPU’ Acceleration
-
{maketools} 1.0.0: Exploring and Testing the Toolchain and System Libraries
-
{rdrop2} 0.8.2.1: Programmatic Interface to the ‘Dropbox’ API
-
{gkgraphR} 1.0.1: Accessing the Official ‘Google Knowledge Graph’ API
-
{tabularmaps} 0.1.0: Create Tile-Grid Geographical Maps
-
{NBShiny3} 0.1.0: Interactive Document for Working with Naive Bayes Classification
-
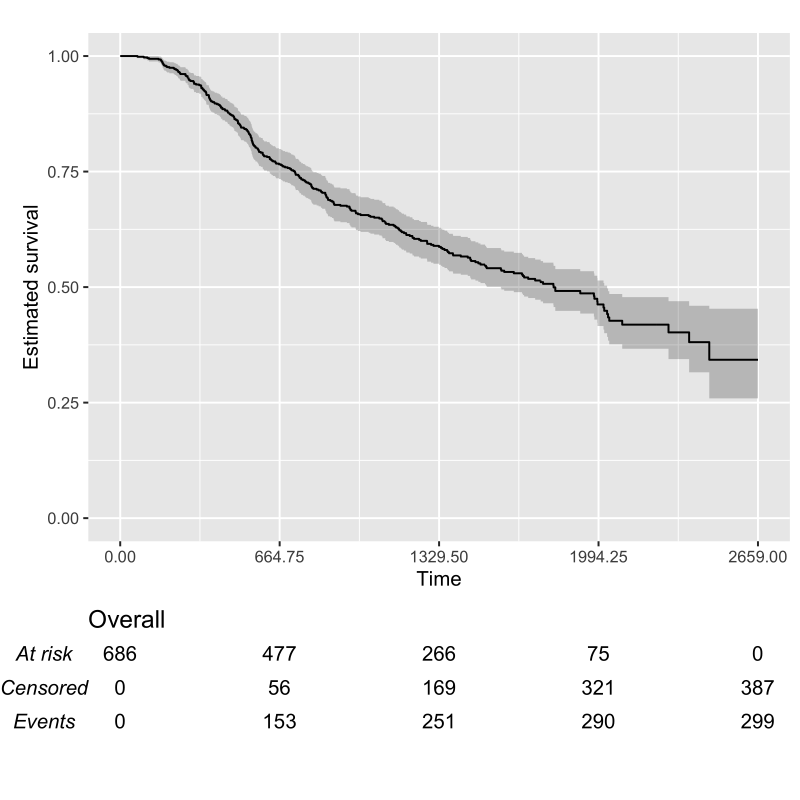
{KMunicate} 0.0.2: KMunicate-Style Kaplan–Meier Plots

- {bspm} 0.3.4: Bridge to System Package Manager
GitHub or Bitbucket
-
packer- An opinionated framework for using JavaScript with R -
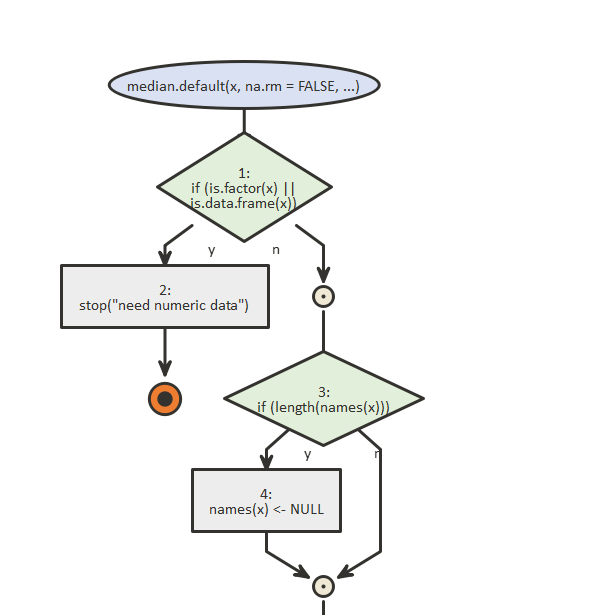
flow- Visualize as flow diagrams the logic of functions, expressions, or scripts and ease debugging

-
shinykeyboard- R package to create an on-screen keyboard as a custom Shiny input binding -
Introducing ‘pixelweaver’ - Convert arrays/matrices to packed ARGB32 colour format

Updated Packages
-
{tidyHeatmap} 1.1.4: A Tidy Implementation of Heatmap
-
{shinybrms} 1.3.0: Graphical User Interface (‘Shiny’ App) for Package ‘brms’
-
{ipaddress} 0.4.0: Tidy IP Addresses
-
{DT} 0.15: A Wrapper of the JavaScript Library ‘DataTables’
-
{paws} 0.1.9: Amazon Web Services Software Development Kit
-
{neo4jshell} 0.1.1: Querying and Managing ‘Neo4J’ Databases in ‘R’
-
{vov} 0.1.1: CSS Animations for ‘shiny’ Elements
-
{modelsummary} 0.5.1: Summary Tables and Plots for Statistical Models and Data: Beautiful, Customizable, and Publication-Ready
-
{brickr} 0.3.5: Emulate LEGO Bricks in 2D and 3D
-
{rayshader} 0.19.2: Create Maps and Visualize Data in 2D and 3D
Videos and Podcasts
Tutorials

R Project Updates
Updates from R Core:
Upcoming Events in 3 Months
Events in 3 Months:
Datasets
-
{ukpolice} 0.2.2: Download Data on UK Police and Crime
-
{climate} 0.9.8: Interface to Download Meteorological (and Hydrological) Datasets
Call for Participation
<+ rstudio::global() call for talks until August the 14th
class=”hide-support added-hostname support-rweekly” style=”text-align: center;font-weight: bold;”>Your support will keep R Weekly team moving! 💡</p>
Quotes of the Week
This is a huge announcement that hasn't gotten much attention yet. #rstats users will finally be able to get their bar graphs with hatching:
— Claus Wilke (@ClausWilke) August 6, 2020
Gradient fill, pattern fill, masks, and clipping paths in the R graphics engine. https://t.co/8KPDsPVFUv pic.twitter.com/snDKSiBmlQ
M secret debugging technique in #RStats: automatically search for the error on #stackoverflow. Hacker level over 9000 😂 pic.twitter.com/0C79j9iRU9
— Thomas Neitmann (@thomas_neitmann) August 8, 2020
Sidetracked by @JonTheGeek - animated hex with movement from a 2d physics simulation.
— mikefc (@coolbutuseless) August 9, 2020
* Orchestrated in #RStats
* Sim in Chipmunk2d
* Image rendering in CairoGraphics pic.twitter.com/gSfTIOFqQR