R Weekly 2020-41 package development topics, contributing to rOpenSci, learnr and shiny
Release Date: 2020-10-12
This week’s release was curated by Eric Nantz, with help from the RWeekly team members and contributors.
Highlight
-
Picking and researching blog topics about R package development
-
Hacktober? Any Month is a Good Month to Contribute to rOpenSci
-
Shiny Developer Series Episode 14 - Shining a Light on {learnr}
Insights
-
Picking and researching blog topics about R package development
-
Hacktober? Any Month is a Good Month to Contribute to rOpenSci
R in the Real World
R in Organizations
R in Academia
Resources
New Packages
CRAN
-
{SSHAARP} 1.0.1: Searching Shared HLA Amino Acid Residue Prevalence
-
{T4transport} 0.1.0: Tools for Computational Optimal Transport
-
{gglm} 0.1.0: Grammar of Graphics for Linear Model Diagnostic Plots
-
{AirSensor} 1.0.2: Process and Display Data from Air Quality Sensors
-
{spDates} 1.0: Analysis of Spatial Gradients in Radiocarbon Dates
-
{quickerstats} 0.0.1: An ‘R’ Client for the ‘USDA NASS Quick Stats API’
-
{MSGARCHelm} 0.1.0: Hybridization of MS-GARCH and ELM Model
-
{dCUR} 1.0.0: Dimension Reduction with Dynamic CUR
-
{EHR} 0.3-1: Electronic Health Record (EHR) Data Processing and Analysis Tool
-
{LDheatmap} 1.0-4: Graphical Display of Pairwise Linkage Disequilibria Between SNPs
-
{sketch} 1.0.3: Interactive Sketches

-
{BIGDAWG} 2.3.1: Case-Control Analysis of Multi-Allelic Loci
-
{TVMM} 3.2: Multivariate Tests for the Vector of Means
-
{skynet} 1.4.0: Generates Networks from BTS Data
-
{modeltime.ensemble} 0.2.0: Ensemble Algorithms for Time Series Forecasting with Modeltime
-
{hdiVAR} 1.0.1: Statistical Inference for Noisy Vector Autoregression
-
{fanovaGraph} 1.5: Building Kriging Models from FANOVA Graphs
-
{satin} 1.0: Visualisation and Analysis of Ocean Data Derived from Satellites
-
{quantdr} 1.0.0: Dimension Reduction Techniques for Conditional Quantiles
-
{PVplr} 0.1.0: Performance Loss Rate Analysis Pipeline
-
{Momocs} 1.3.2: Morphometrics using R
-
{sivs} 0.2.2: Seed Independent Variable Selection
-
{occCite} 0.3.0: Querying and Managing Large Biodiversity Occurrence Datasets
-
{cmsafvis} 1.0.0: Visualize CM SAF NetCDF Data
-
{suppdata} 1.1-4: Downloading Supplementary Data from Published Manuscripts
-
{blink} 1.1.0: Record Linkage for Empirically Motivated Priors
-
{treeducken} 1.0.0: Nested Phylogenetic Tree Simulator
-
{FunWithNumbers} 1.0: Fun with Fractions and Number Sequences
-
{CNAIM} 1.0.0: Common Network Asset Indices Methodology (CNAIM)
-
{winch} 0.0.1: Portable Native and Joint Stack Traces
-
{REPPlabShiny} 0.4.0: ‘REPPlab’ via a Shiny Application
-
{pvldcurve} 1.2.6: Simplifies the Analysis of Pressure Volume and Leaf Drying Curves
-
{mapboxapi} 0.2: R Interface to ‘Mapbox’ Web Services
-
{animalEKF} 1.1: Extended Kalman Filters for Animal Movement
-
{PairViz} 1.3.4: Visualization using Graph Traversal
-
{gmGeostats} 0.10-7: Geostatistics for Compositional Analysis
-
{zenplots} 1.0.2: Zigzag Expanded Navigation Plots
-
{priceR} 0.1.5: Economics and Pricing Tools
-
{collidr} 0.1.3: Check for Namespace Collisions Across Packages and Functions on CRAN
-
{concreg} 0.7: Concordance Regression
-
{stfit} 0.99.8: Spatio-Temporal Functional Imputation Tool
BioC
GitHub or Bitbucket
-
{cspp}: A Package for The Correlates of State Policy Project Data
-
{rockthemes}: R colour palettes based on classic (rock) albums

Updated Packages
-
Robust covariance matrix estimation: sandwich 3.0-0, web page, JSS paper
-
{wrGraph} 1.0.5: Graphics in the Context of Analyzing High-Throughput Data
-
{stringdist} 0.9.6.3: Approximate String Matching, Fuzzy Text Search, and String Distance Functions
-
{textshaping} 0.1.2: Bindings to the ‘HarfBuzz’ and ‘Fribidi’ Libraries for Text Shaping
-
{callr} 3.5.0: Call R from R
-
{analogsea} 0.9.0: Interface to ‘Digital Ocean’
-
{waldo} 0.2.1: Find Differences Between R Objects
-
{clipr} 0.7.1: Read and Write from the System Clipboard
-
{sunburstR} 2.1.5: Sunburst ‘Htmlwidget’
-
{dittodb} 0.1.2: A Test Environment for Database Requests
-
{gert} 1.0.0: Simple Git Client for R
-
{Tplyr} 0.1.3: A Grammar of Clinical Data Summary
-
{tinytest} 1.2.3: Lightweight and Feature Complete Unit Testing Framework
-
{bigrquery} 1.3.2: An Interface to Google’s ‘BigQuery’ ‘API’
-
{readabs} 0.4.5: Download and Tidy Time Series Data from the Australian Bureau of Statistics
-
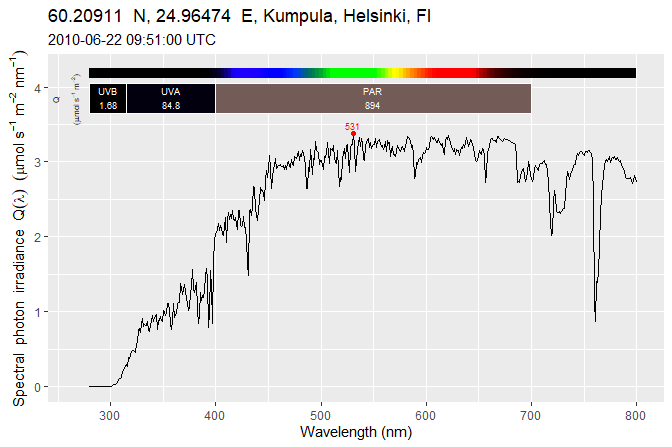
{ggspectra} 0.3.7: Extensions to ‘ggplot2’ for Radiation Spectra

-
{htmlwidgets} 1.5.2: HTML Widgets for R
-
{shinyWidgets} 0.5.4: Custom Inputs Widgets for Shiny
Videos and Podcasts
-
Sentiment Analysis in R with Custom Lexicon Dictionary using tidytext
-
Shiny Developer Series Episode 14 - Shining a Light on {learnr}
-
Modeling #TidyTuesday NCAA women’s basketball tournament seeds
Gist & Cookbook
Shiny Apps
-
{shinyMatrix} 0.4.0: Shiny Matrix Input Field
-
{shinyML} 1.0.0: Compare Supervised Machine Learning Models Using Shiny App

Tutorials

R Project Updates
Updates from R Core:
Upcoming Events in 3 Months
Events in 3 Months:
Datasets
-
Downloading food web databases and deriving basic structural metrics
-
{pmlbr} 0.2.0: Interface to the Penn Machine Learning Benchmarks Data Repository
Call for Participation
Quotes of the Week
How it started. How it’s going. pic.twitter.com/HOTHA1N9Bn
— Julia Silge (@juliasilge) October 9, 2020
Hacked something together: an R addin/shiny app to learn SQL using duckdb and built-in R datasets. Each exercise asks you to replicate a dplyr ordata.table statement in sql. https://t.co/bsc6ibbCIo
— Dirk Schumacher🚲 (@dirk_sch) October 11, 2020
Just a proof of concept of a quick idea. Feedback welcome. #rstats pic.twitter.com/zIytjxFpOQ
Hey #rstats, 📦 vembedr 1.4.0 now on CRAN 🎉
— Ian Lyttle (@ijlyttle) October 11, 2020
Embed videos from YouTube, Vimeo, and more in RMarkdown HTML documents!https://t.co/5wH54gAYlz pic.twitter.com/SEejZ60SoL