R Weekly 2021-W03 Habit, Soccer, Call for Tutorials
This week’s release was curated by Wolfram King, with help from the R Weekly team members and contributors.
Highlight
Insights
R in the Real World

R in Organizations
New Packages
CRAN
-
{prompter} 1.0.0: Add tooltips in shiny apps via hint.css
-
{thematic} 0.1.1: Unified and Automatic ‘Theming’ of ‘ggplot2’, ‘lattice’, and ‘base’ R Graphics
-
{ggOceanMaps} 1.0.9: Plot Data on Oceanographic Maps using ‘ggplot2’
-
{node2vec} 0.1.0: Algorithmic Framework for Representational Learning on Graphs
-
{bayesian} 0.0.2: Bindings for Bayesian TidyModels
-
{html5} 0.1.0: Generates HTML Tag Strings for HTML5 Elements Included in Mozilla’s Documentation of HTML5
-
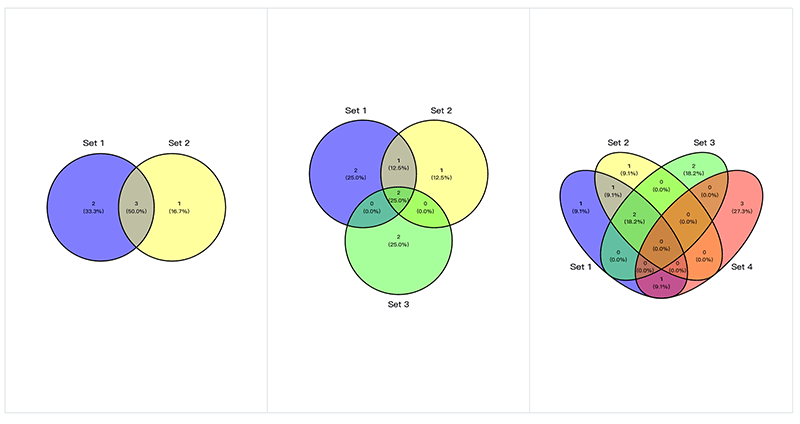
{ggvenn} 0.1.8: Draw Venn Diagram by ‘ggplot2’
-
{resumer} 0.0.4: Build Resumes with R
-
{knitcitations} 1.0.12: Citations for ‘Knitr’ Markdown Files
GitHub or Bitbucket
-
{preferably} 0.3.0 : An accessible template for pkgdown websites with dynamic light/dark mode support.
-
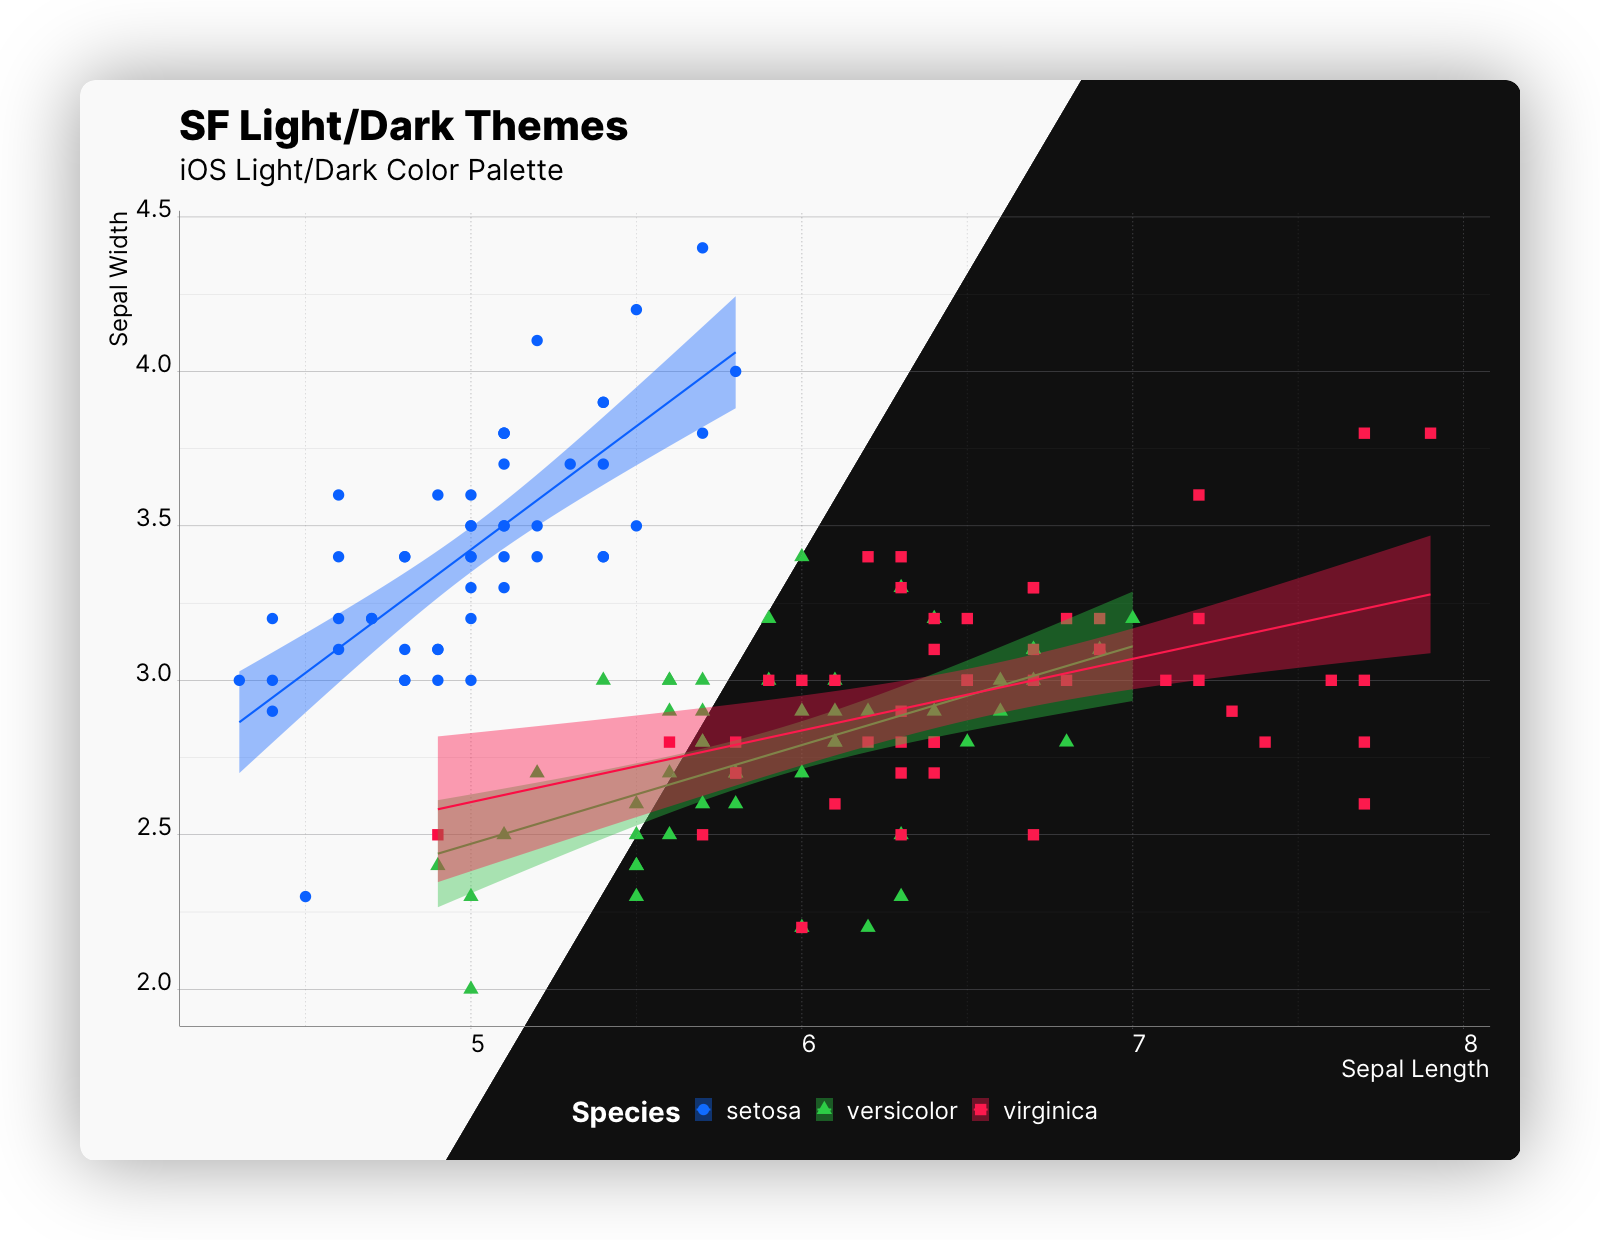
{sfthemes} 0.2.0 : An accessible set of ggplot2 themes and color palettes optimized for light/dark appearances, and different screen sizes.
- {feather}: Colour palettes for data visualisation, inspired by the plumage of Australian birds.
Updated Packages
-
{glmnet} 4.1: Regularized Cox models for start, stop and stratified data
-
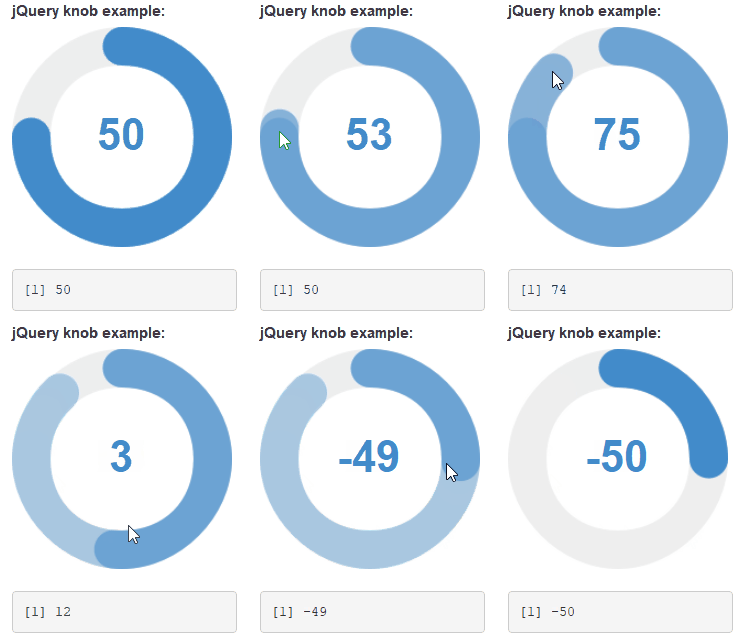
{shinyWidgets} 0.5.5: Custom Inputs Widgets for Shiny
-
{DBI} 1.1.1: R Database Interface
-
{altair} 4.1.1: Interface to ‘Altair’
-
{magick} 2.6.0: Advanced Graphics and Image-Processing in R
-
{googleCloudRunner} 0.4.0: R Scripts in the Google Cloud via Cloud Run, Cloud Build and Cloud Scheduler
-
{pROC} 1.17.0.1: Display and Analyze ROC Curves
-
{ggformula} 0.10.1: Formula Interface to the Grammar of Graphics
-
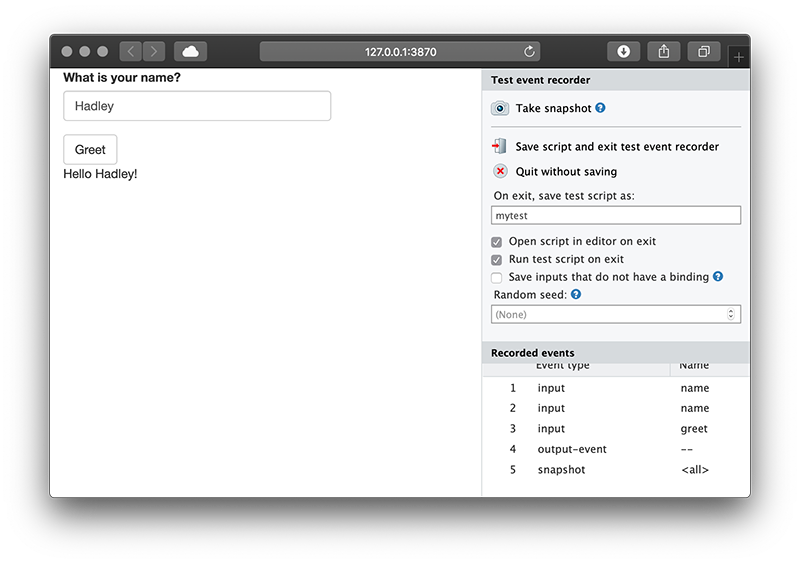
{shinytest} 1.5.0: Test Shiny Apps
-
{httpuv} 1.5.5: HTTP and WebSocket Server Library
-
{cpp11} 0.2.5: A C++11 Interface for R’s C Interface
-
{BH} 1.75.0-0: New upstream release, added Beast
-
{Rcpp} 1.0.6: Seamless R and C++ Integration
-
{Shiny Server} 1.5.16: Important Security Notice
Videos and Podcasts
Shiny Apps
Tutorials
-
Automatically installing Shiny and RStudio server on Raspberry Pi OS with Ansible
-
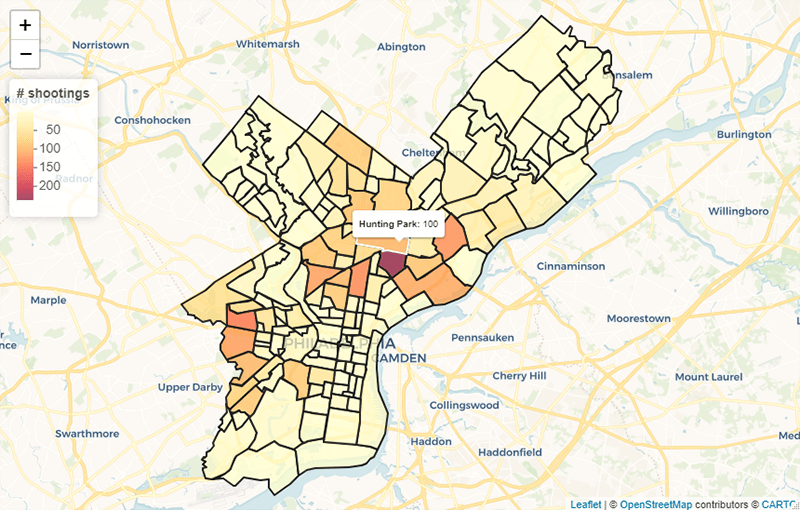
Visualizing geospatial data in R—Part 3: Making interactive maps with leaflet
-
R Shiny {golem} - Initializing Your Project - Part 2 - Development to Production
-
Empirical Economics with R (Part B): Confounders, Proxies and Sources of Exogenous Variations
-
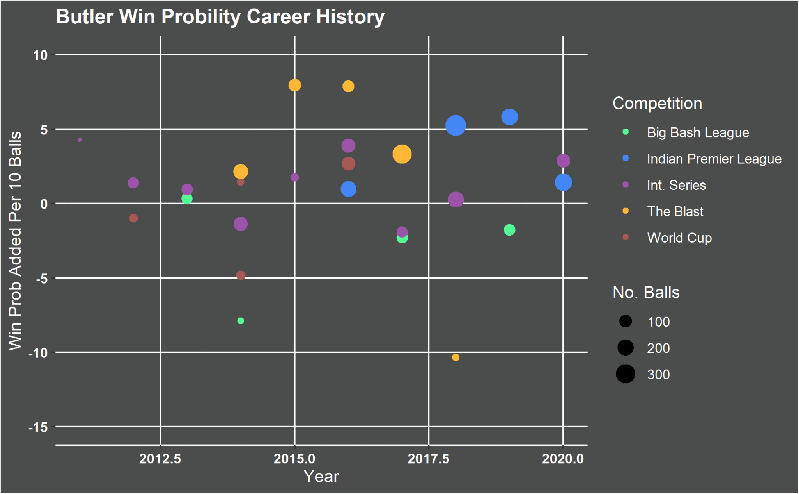
GooglyPlusPlus2021 interactively ranks T20 batsmen and bowlers!!!
-
Why Gradient Descent Works (and How To Animate 3D-Functions in R)
-
lmDiallel: a new R package to fit diallel models. The Griffing’s models (1956)
R Project Updates
Updates from R Core:
Upcoming Events in 3 Months
Events in 3 Months:
Call for Participation
Quotes of the Week
#rstats #rspatial inspired by https://t.co/di4PSmdzhy it is now possible to add image & graph popups as tooltips (on hover rather than click) by setting `tooltip = TRUE` in the respective functions. E.g. leafpop::addPopupGraphs(..., tooltip = TRUE)👇 pic.twitter.com/JFpqEW5Xxy
— TimSalabim (@TimSalabim3) January 9, 2021
Type "I love R because" and let your autocomplete finish.
— Colin Fay 🤘 (@_ColinFay) January 14, 2021
I'll start:
I love R because it's the only way to get to the point where you are not supposed to be. #RStats