R Weekly 2021-11 Time series, Stock scraping, Knitr options
This week’s release was curated by Robert Hickman, with help from the R Weekly team members and contributors.
Highlight
Insights
R in the Real World
R in Organizations
Shiny
Resources

-
https://thierrymoudiki.github.io/blog/2021/03/12/python/explainableml/teller-xgboost
-
torch time series continued: A first go at multi-step prediction
-
Upcoming Why R Webinar - Tabular reporting with the flextable package


-
https://thierrymoudiki.github.io/blog/2021/03/12/python/explainableml/teller-xgboost
-
torch time series continued: A first go at multi-step prediction
-
Upcoming Why R Webinar - Tabular reporting with the flextable package
-
From multinomial regression to binary classification on some siamese data
New Packages
- rumpel - manipulate objects by their names (github.com)
Updated Packages
-
RcppArmadillo 0.10.2.2.0 on CRAN: New Upstream Patch Release
-
{emayili:0.4.6} Attachments with UTF-8 Filenames & Setting Sender
Videos and Podcasts
-
Shiny Developer Series Episode 19: Climbing the Ladder of Shiny Mastery with Hadley Wickham
-
Speeding up plot creation can be as simple as specifying the ragg device within ggsave!
-
Why R? Webinar 039 - D. Gohel - officeverse : Creating Word and PowerPoint documents with R
R Internationally
Tutorials
-
k-Means 101: An introductory guide to k-Means clustering in R
-
Protected: DataCoaster Tycoon: Building 3D Rollercoaster Tours of Your Data in R with rayrender
-
Daily Stock Gainers Automated Web Scraping in R with Github Actions
aRt
This is. Bathymetry of the Baltic Sea. Here it is in monochrome.#rayshader adventures, an #rstats tale https://t.co/RIxJnGXQ2e pic.twitter.com/zrG9XpjsaZ
— flotsam (@researchremora) March 12, 2021
My accidental #rstats art is going up on the office wall! Big day! pic.twitter.com/5rZV1vEo8g
— Mike Kearney📊 (@kearneymw) March 10, 2021
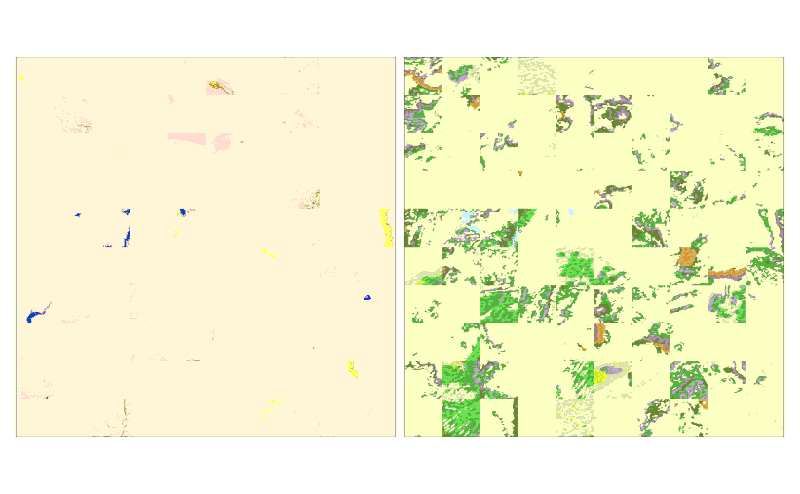
A simple script to make a collage of two random photos from Unsplash, powered by {magick} and {ggfx}#Rstats code: https://t.co/UbBpPiQbHS pic.twitter.com/fR8dS9GTUu
— Georgios Karamanis (@geokaramanis) March 13, 2021
For this #TidyTuesday, I used a beeswarm and stream plot to look at the movies which pass the bechdel test, minding the number of movies, and look specifically at the main genres.
— Christophe Nicault (@cnicault) March 10, 2021
Code : https://t.co/Pqie3OtgA3#rstats #dataviz #TidyTuesday #r4ds #tidyverse pic.twitter.com/1KheXbqPjZ
R Project Updates
Updates from R Core:
Upcoming Events in 3 Months
Events in 3 Months:
-
March 19, 26 vieRnes de maRzo, tutorials from Curso R, USAL
-
March 17: Interactive maps with Leaflet
-
March 18: The role of Data Journalism in the Covid-19 pandemic
-
March 5 - May 21: TIER Symposium on instruction in resproducible research
-
May 14th: Time to get your Shiny on, Shiny Contest 2021 is here!
-
May 26-28: NIMBLE virtual short course
-
June 1: “Introduction to R” pre-conference workshop for PuG (German)
-
June 1: “Reproducibility in R” pre-conference workshop for PuG
Datasets
Jobs
Call for Participation
Quotes of the Week
The most wonderful #rstats package I've ever made for myself. pic.twitter.com/o4C3g0Mtpj
— jo-sigh-ughhh (@JosiahParry) March 13, 2021
more fun with #RStats #purrr compose() to help make these cool code pics in carbonate pic.twitter.com/Es9Lr5pSjs
— Jeremy Allen (@jeremy_data) March 14, 2021
🛡️✨ You can use {badgr} in #RStats to make a readme badge that links to your #RShiny app. Here's an example from the https://t.co/ZgnHvQaJew repository. pic.twitter.com/JDqgCfjr5B
— Matt Dray (@mattdray) March 12, 2021