R Weekly 2021-W24
This week’s release was curated by Tony ElHabr, with help from the R Weekly team members and contributors.
Highlight
-
Everybody Loves Raymond: Running Animal Crossing Villagers through the Google Vision API
-
Shiny Developer Series Episode 21: RStudio software engineer Nick Strayer returns to share how he arrived to RStudio and motivations behind the new Shiny App Stories.
Insights
-
Building Effective Data Science Teams: Answering Your Questions
-
New TabularData Available in Swift on macOS Monterery (et al)
R in the Real World
New Packages
CRAN
- {fitbitr} 0.1.0: Interface with the ‘Fitbit’ API
- {daiR} 0.9.0: Interface with Google Cloud Document AI API
- {mcboost} 0.3.0: Multi-Calibration Boosting
- {jackstraw} 1.3.1: Statistical Inference for Unsupervised Learning
GitHub or Bitbucket
- {codehover}: Hoverable HTML Table for Displaying Intermediary Code Results (e.g. Pipes)
- {plotme}: Human friendly interface for plots that are otherwise quite hard to create in R (e.g. sunburst)
Updated Packages
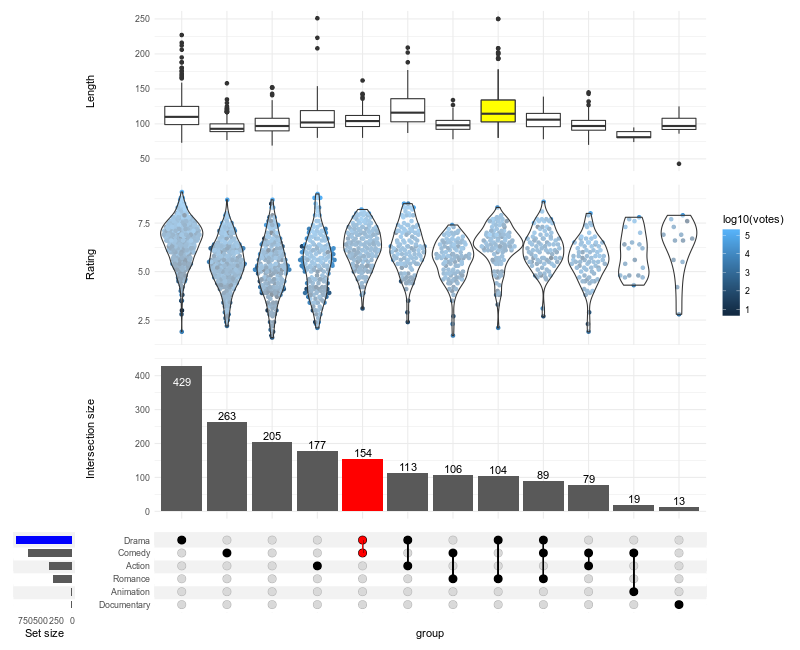
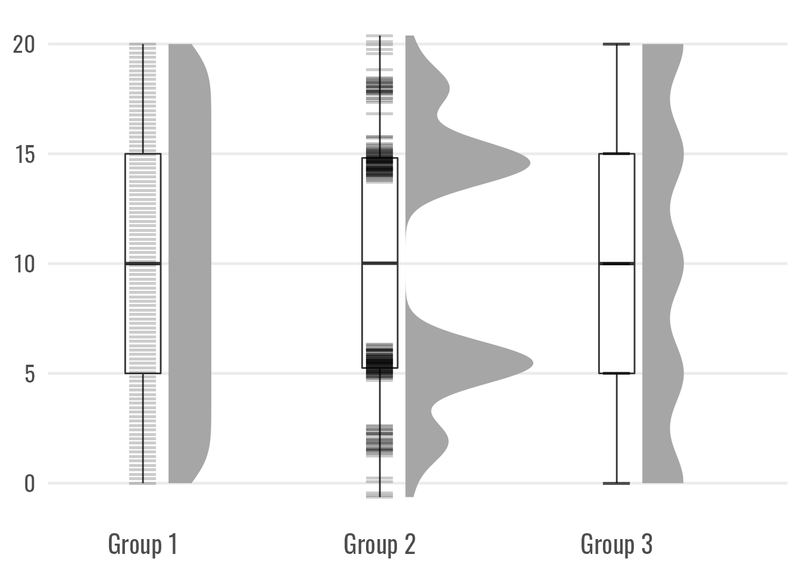
- {ComplexUpset} 1.3.0: Create Complex UpSet Plots Using ‘ggplot2’ Components
- {gghighlight} 0.3.2: Highlight Lines and Points in ‘ggplot2’
- {progressr} 0.8.0:: An Inclusive, Unifying API for Progress Updates
- {mapsapi} 0.4.9: ‘sf’-Compatible Interface to ‘Google Maps’ APIs
- {themis} 0.1.4: Extra Recipes Steps for Dealing with Unbalanced Data
- {wrapr} 2.0.8: Wrap R Tools for Debugging and Parametric Programming
- {cdata} 1.2.0: Fluid Data Transformations
- {torch} 0.4.0: Tensors and Neural Networks with ‘GPU’ Acceleration
- {mlr3data} 0.4.0: Collection of Machine Learning Data Sets for ‘mlr3’
- {radiant} 1.4.0: Business Analytics using R and Shiny
- {sparklyr} 1.7.0: R Interface to Apache Spark
- {tidyBF} 0.5.1: Tidy Wrapper for ‘BayesFactor’ Package
- {ffscrapr} 1.4.3: API Client for Fantasy Football League Platforms
Videos and Podcasts
-
Shiny Developer Series Episode 21: RStudio software engineer Nick Strayer returns to share how he arrived to RStudio and motivations behind the new Shiny App Stories.
-
#33: Collaborative Editing and Execution in Shared Byoby Sessions
-
TidyX Episode 62 | Data Cleaning - Regex Applied & stringr : Ellis Hughes and Patrick Ward continue their regular expressions exploration
Gist & Cookbook
Tutorials
-
Everybody Loves Raymond: Running Animal Crossing Villagers through the Google Vision API
-
Financial X-Rays: Dissect any Price Series with a simple Payoff Diagram
R Project Updates
Updates from R Core:
Upcoming Events in 3 Months
Events in 3 Months:
Datasets
Call for Participation
Quotes of the Week
How much do you need to earn to be able to buy the average house in your region?
— Emma Vitz (@EmmaVitz) June 9, 2021
I saw an equivalent map for the US and decided to replicate it for NZ. Based on the common financial advice that you shouldn't spend more than 30% of your income on your housing. #rstats #rspatial pic.twitter.com/sUvLWT2QoJ
Oh, you write R code? Well how about I follow you and like all your tweets 😤
— Afton Leigh Coombs (@aftonsteps) June 11, 2021
It is what it is. #RStats #RStudio #poptwitter #dataviz #DataScience pic.twitter.com/bDLSEDm2LV
— Corina McCullough Vidal, M.S. (@demography101) June 8, 2021