R Weekly 2023-W34 Cleaning Data, Analyzing Data, and Infinite Data
This week’s release was curated by Jonathan Carroll, with help from the RWeekly team members and contributors.
Highlight
Insights

- Taking from Infinite Sequences
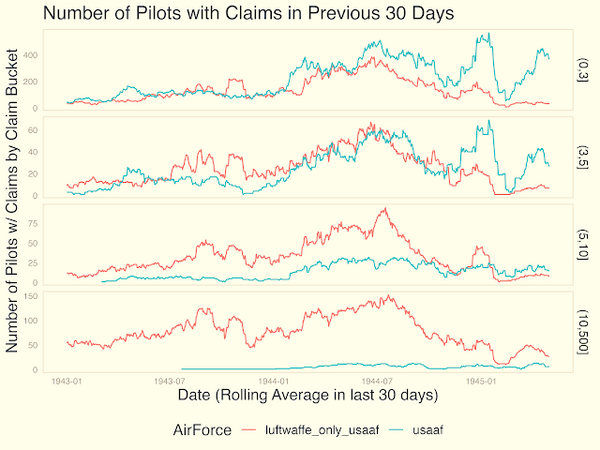
- Analyzing new USDA data using open source tools
- Little useless-useful R functions – Goldbach’s conjecture and Sieve of Sundaram
- Can a Simple Multi-Agent Model Replicate Complex Stock Market Behaviour?
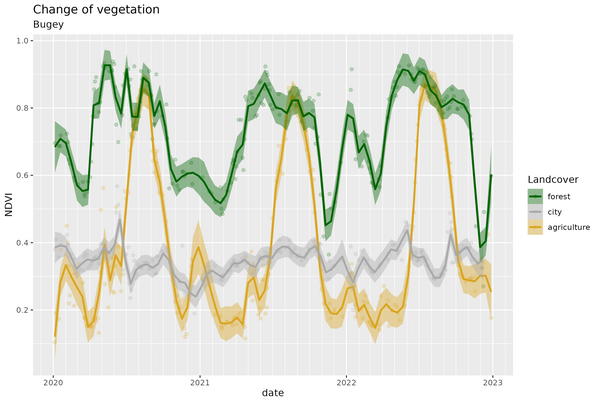
- Copernicus OpenEO NDVI time series

- How to Sum Rows in R: Master Summing Specific Rows with dplyr
- How to Check if a File is Empty in R: Practical Examples
- Ordinal Models for Paired Data
- #43: r2u Faster Than the Alternatives
- #41: Using r2u in Codespaces
- Exploring Data Distribution with Box Plots in R
- Mastering Data Approximation with R’s approx() Function
- Exploring the Power of the curve() Function in R
- Solving Systems of Equations in R using the solve() Function
- The substring() function in R
-
pmax() and pmin(): Finding the Parallel Maximum and Minimum in R
- Tidy Tuesday: Spam mail
R in the Real World

R in Academia
R Users
Resources
New Packages
CRAN
-
{happign} 0.2.0: Easy acces to IGN data (French National Geographic Institute)
-
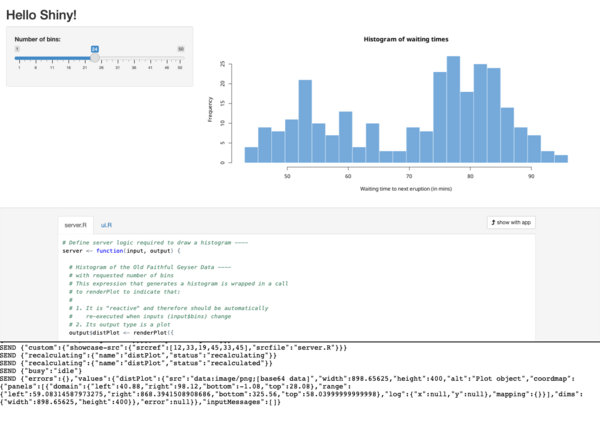
{shiny.emptystate} 0.1.0: Empty State Components for ‘Shiny’ (post)
- {gghdx} 0.1.1: HDX Theme, Scales, and Other Conveniences for ‘ggplot2’
- {dateback} 1.0.2: Collect and Install R Packages on a Specified Date with Dependencies
- {Rgb} 1.7.5: The R Genome Browser
- {itscalledsoccer} 0.2.3: American Soccer Analysis API Client
- {formods} 0.1.1: ‘Shiny’ Modules for General Tasks
- {f1dataR} 1.3.0: Access Formula 1 Data
- {YTAnalytics} 0.0.4: Wrapper for ‘YouTube Analytics’ API
- {lettervalue} 0.1.0: Computing Letter Values
- {easy.utils} 0.0.1: Frequently Used Functions for Easy R Programming
- {codecountR} 0.0.2.0: Counting Codes in a Text and Preparing Data for Analysis
- {ggordiplots} 0.4.2: Make ‘ggplot2’ Versions of Vegan’s Ordiplots
- {lit} 1.0.0: Latent Interaction Testing for Genome-Wide Studies
- {bulkreadr} 0.1.0: The Ultimate Tool for Reading Data in Bulk
- {jqbr} 1.0.3: ‘jQuery QueryBuilder’ Input for ‘Shiny’
- {osmdata} 0.2.5: Import ‘OpenStreetMap’ Data as Simple Features or Spatial Objects
- {screenshot} 0.9.0: Take Screenshots (Screen Capture) from R Command
GitHub or Bitbucket
Updated Packages
- {tidyEmoji} 0.1.1: Discovers Emoji from Text - diffify
- {hash} 2.2.6.3: Full Featured Implementation of Hash Tables/Associative Arrays/Dictionaries - diffify
- {wrapr} 2.1.0: Wrap R Tools for Debugging and Parametric Programming - diffify
- {leaflegend} 1.1.1: Add Custom Legends to ‘leaflet’ Maps - diffify
- {geomapdata} 2.0-2: Data for Topographic and Geologic Mapping - diffify
- {RSQL} 0.2.2: Database Agnostic Package to Generate and Process ‘SQL’ Queries in R - diffify
- {RcppRedis} 0.2.4: ‘Rcpp’ Bindings for ‘Redis’ using the ‘hiredis’ Library - diffify
- {quantreg} 5.97: Quantile Regression - diffify
- {nasapower} 4.0.11: NASA POWER API Client - diffify
- {GMMBoost} 1.1.5: Likelihood-Based Boosting for Generalized Mixed Models - diffify
- {BT} 0.4: (Adaptive) Boosting Trees Algorithm - diffify
- {emayili} 0.7.17: Send Email Messages - diffify
- {fontawesome} 0.5.2: Easily Work with ‘Font Awesome’ Icons - diffify
- {Rlabkey} 2.12.0: Data Exchange Between R and ‘LabKey’ Server - diffify
- {crandep} 0.3.2: Network Analysis of Dependencies of CRAN Packages - diffify
- {languageserver} 0.3.16: Language Server Protocol - diffify
- {Cairo} 1.6-1: R Graphics Device using Cairo Graphics Library for Creating High-Quality Bitmap (PNG, JPEG, TIFF), Vector (PDF, SVG, PostScript) and Display (X11 and Win32) Output - diffify
- {audio} 0.1-11: Audio Interface for R - diffify
- {tok} 0.1.1: Fast Text Tokenization - diffify
- {tikzDevice} 0.12.5: R Graphics Output in LaTeX Format - diffify
- {parsnip} 1.1.1: A Common API to Modeling and Analysis Functions - diffify
- {textrecipes} 1.0.4: Extra ‘Recipes’ for Text Processing - diffify
- {rsconnect} 1.0.2: Deploy Docs, Apps, and APIs to ‘Posit Connect’, ‘shinyapps.io’, and ‘RPubs’ - diffify
- {ggspatial} 1.1.9: Spatial Data Framework for ggplot2 - diffify
- {fusen} 0.5.2: Build a Package from Rmarkdown Files - diffify
- {emmeans} 1.8.8: Estimated Marginal Means, aka Least-Squares Means - diffify
- {hockeystick} 0.8.1: Download and Visualize Essential Climate Change Data - diffify
- {uuid} 1.1-1: Tools for Generating and Handling of UUIDs - diffify
- {proj4} 1.0-13: A simple interface to the PROJ.4 cartographic projections library - diffify
- {shinyChatR} 1.1.0: R Shiny Chat Module - diffify
- {pins} 1.2.1: Pin, Discover and Share Resources - diffify
- {jstor} 0.3.11: Read Data from JSTOR/DfR - diffify
Videos and Podcasts
Tutorials
Reproducible data science with Nix, part 4 – So long, {renv} and Docker, and thanks for all the fish
R Project Updates
Updates from R Core:
Upcoming Events in 3 Months
Events in 3 Months:
Jobs
💼 Explore Jobs & Gigs Board on RStudio Community 💼