R Weekly 2025-W40 Ducklake, Slidecrafting, Shiny & LLMs
This week’s release was curated by Eric Nantz, with help from the R Weekly team members and contributors.
Highlight
Insights
R in the Real World
- A Novel Analysis — Literally - Readability & lexical dispersion of a novella using quanteda, ggplot2 and gutenbergr.
R in Academia
Tutorials
-
Combining any model with GARCH(1,1) for probabilistic stock forecasting
-
Generating Synthetic Data with R-vine Copulas using esgtoolkit in R
-
Clean R Tests with
local_mocked_bindingsand Dependency Wrapping
Resources
New Packages
📦 Keep up to date wtih CRANberries 📦
CRAN
-
{gglyph} 0.2.0: Network-Style Visualization of Directed Pairwise Relationships
-
{elixir} 0.1.0: Transmutation of Languages
-
{containr} 0.1.1: Containerize Your ‘R’ Project
-
{bnpMTP} 1.0.0: Bayesian Nonparametric Sensitivity Analysis of Multiple Testing Procedures for p Values
-
{diegr} 0.1.0: Dynamic and Interactive EEG Graphics
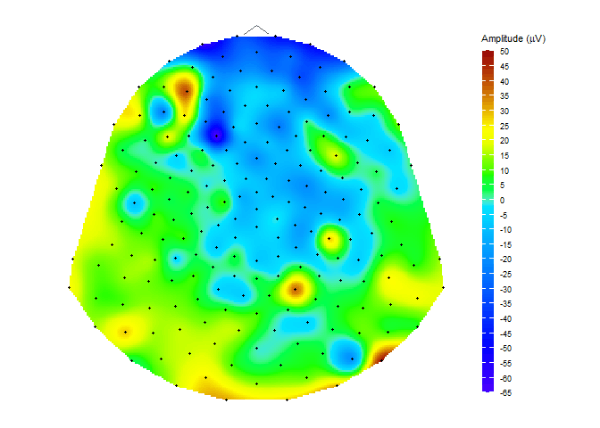
2025/W40/README-topoplot-1-resized.png
-
{dtlg} 0.0.2: A Performance-Focused Package for Clinical Trial Tables
-
{edgemodelr} 0.1.0: Local Language Model Inference
-
{PortfolioTesteR} 0.1.1: Test Investment Strategies with English-Like Code
-
{player} 0.1.0: Play Games in the Console
-
{screenshotbase} 0.1.0: Client for the ‘Screenshotbase’ API
-
{piecemeal} 0.1.0: Wrangle Large Simulation Studies
-
{linkeR} 0.1.2: Link Interactive Plots and Tables in ‘shiny’ Applications
-
{modelSelection} 1.0.3: High-Dimensional Model Selection
-
{glioblastomaEHRsData} 0.1.0: Descriptive Analysis on 3 EHRs Datasets
-
{ggDNAvis} 0.2.1: ‘ggplot2’-Based Tools for Visualising DNA Sequences and Modifications
-
{DAGassist} 0.2.4: Test Robustness with Directed Acyclic Graphs
GitHub or Bitbucket
- blueycolors: Provides bluey-inspired color pallettes and ggplot2 scales
Updated Packages
-
progressr 0.16.0 on CRAN: An Inclusive, Unifying API for Progress Updates
-
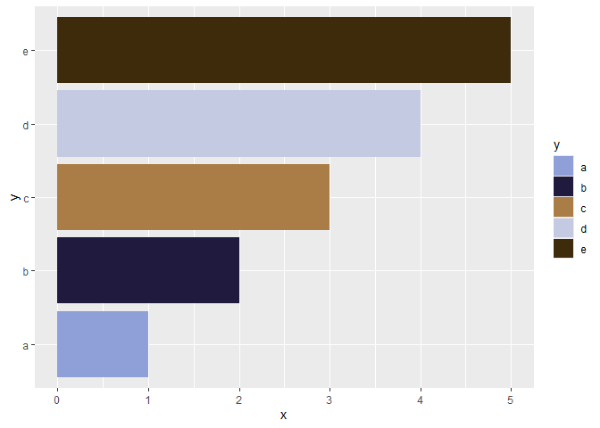
ggsci 4.0.0: 400+ new color palettes
-
{V8} 7.0.0: Embedded JavaScript and WebAssembly Engine for R - diffify
-
{SqlRender} 1.19.4: Rendering Parameterized SQL and Translation to Dialects - diffify
-
{papaja} 0.1.4: Prepare American Psychological Association Journal Articles with R Markdown - diffify
-
{fuzzySim} 4.36: Fuzzy Similarity in Species Distributions - diffify
-
{CausalImpact} 1.4.1: Inferring Causal Effects using Bayesian Structural Time-Series Models - diffify
-
{Analitica} 1.8.5: Exploratory Data Analysis, Group Comparison Tools, and Other Procedures - diffify
-
{tabxplor} 1.3.1: User-Friendly Tables with Color Helpers for Data Exploration - diffify
-
{survAUC} 1.4-0: Estimators of Prediction Accuracy for Time-to-Event Data - diffify
-
{simStateSpace} 1.2.11: Simulate Data from State Space Models - diffify
-
{rio} 1.2.4: A Swiss-Army Knife for Data I/O - diffify
-
{plspm} 0.6.0: Partial Least Squares Path Modeling (PLS-PM) - diffify
-
{NNS} 11.6: Nonlinear Nonparametric Statistics - diffify
-
{neonUtilities} 3.0.2: Utilities for Working with NEON Data - diffify
-
{dexter} 1.7.0: Data Management and Analysis of Tests - diffify
-
{rly} 1.7.7: Tools to Create Formal Language Parser - diffify
-
{ArchaeoPhases} 2.1.0: Post-Processing of Markov Chain Monte Carlo Simulations for Chronological Modelling - diffify
-
{eye} 1.3.0: Analysis of Eye Data - diffify
-
{FlexRL} 0.1.1: A Flexible Model for Record Linkage - diffify
-
{statConfR} 0.2.1: Models of Decision Confidence and Measures of Metacognition - diffify
-
{microsimulation} 1.4.5: Discrete Event Simulation in R and C++, with Tools for Cost-Effectiveness Analysis - diffify
-
{dscore} 1.11.0: D-Score for Child Development - diffify
-
{plsdepot} 0.3.0: Partial Least Squares (PLS) Data Analysis Methods - diffify
-
{GPTCM} 1.1.2: Generalized Promotion Time Cure Model with Bayesian Shrinkage Priors - diffify
-
{TrialSimulator} 1.3.0: Clinical Trial Simulator - diffify
-
{metacor} 1.2.0: Meta-Analytic Effect Size Calculation for Pre-Post Designs with Correlation Imputation - diffify
-
{tint} 0.1.6: ‘tint’ is not ‘Tufte’ - diffify
-
{siera} 0.5.4: Generate Analysis Results Programmes Using ARS Metadata - diffify
-
{inTextSummaryTable} 3.3.5: Creation of in-Text Summary Table - diffify
-
{autoslider.core} 0.3.1: Slide Automation for Tables, Listings and Figures - diffify
-
{forcats} 1.0.1: Tools for Working with Categorical Variables (Factors) - diffify
-
{planr} 0.6.1: Tools for Supply Chain Management, Demand and Supply Planning - diffify
-
{ronfig} 0.0.3: Load Configuration Values - diffify
-
{nanoarrow} 0.7.0-1: Interface to the ‘nanoarrow’ ‘C’ Library - diffify
-
{ggcompare} 0.0.5: Mean Comparison in ‘ggplot2’ - diffify
-
{extrafont} 0.20: Tools for Using Fonts - diffify
-
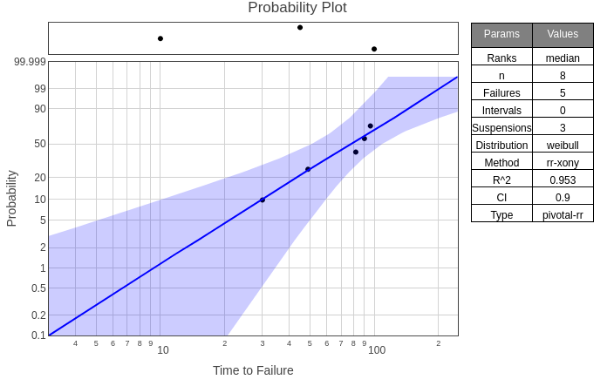
{WeibullR.plotly} 0.3.2: Interactive Weibull Probability Plots - diffify
-
{gt} 1.1.0: Easily Create Presentation-Ready Display Tables - diffify
-
{dataspice} 1.1.1: Create Lightweight Schema.org Descriptions of Data - diffify
-
{waiter} 0.2.5.1: Loading Screen for ‘Shiny’ - diffify
-
{DatabaseConnector} 7.0.0: Connecting to Various Database Platforms - diffify
-
{fastplyr} 0.9.9: Fast Alternatives to ‘tidyverse’ Functions - diffify
-
{networkR} 0.1.5: Network Analysis and Visualization - diffify
Videos and Podcasts
Shiny Apps
R Project Updates
Updates from R Core:
Call for Participation
Upcoming Events in 3 Months
Events in 3 Months:
-
Bayesian Optimization for Sequential Decisions with Multi-Arm Bandits
-
How to use pointblank to understand, validate, and document your data
Connect
Join the Data Science Learning Community
Quotes of the Week
Positron running on a small Raspberry Pi CM5 computer (Hackberry pi). Why am I compelled to do things like this? #rstats #python #quartopub
— Ted Laderas (@tladeras.bsky.social) September 26, 2025 at 10:10 PM
[image or embed]