R Weekly 2025-W43 R Core Contribution, Environment management, Shiny internship
This week’s release was curated by Eric Nantz, with help from the R Weekly team members and contributors.
Highlight
-
How Do I Contribute to R? A Guide to Getting Involved with R Core
-
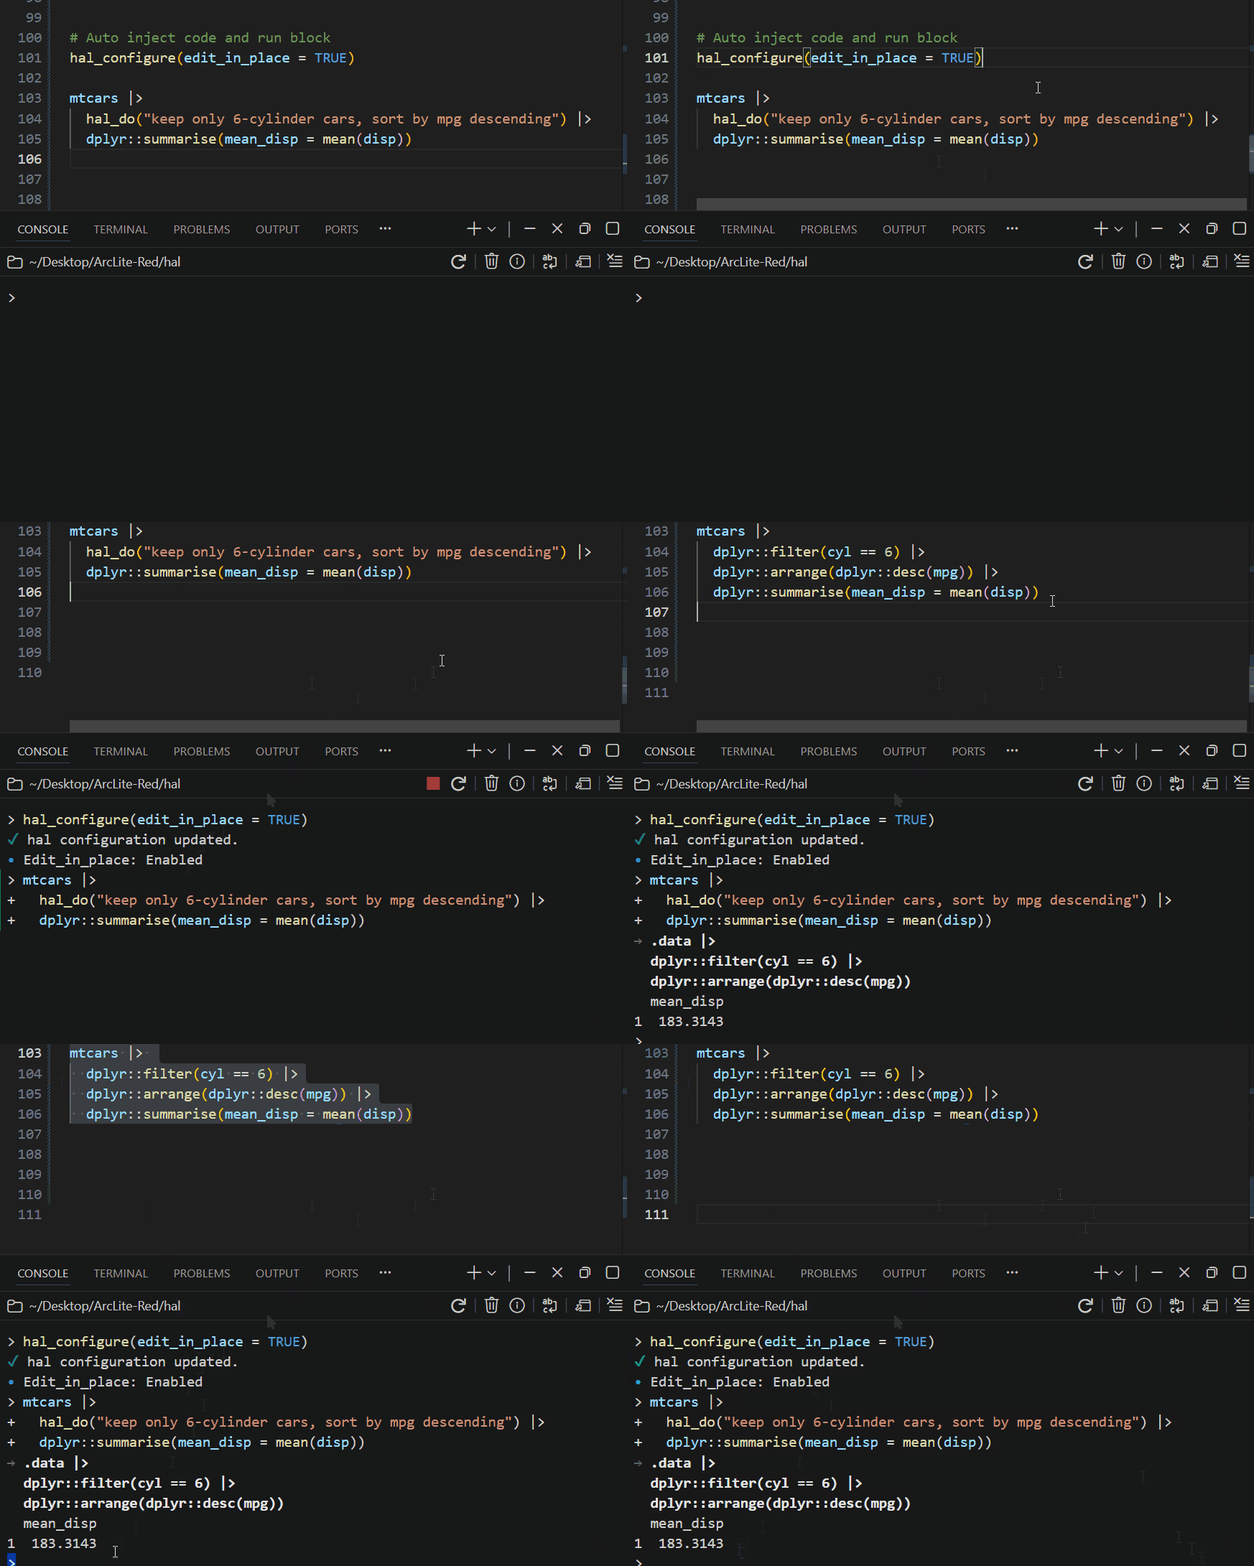
{renv}, {rix}, rv, uvr, ir: An explosion of R package and environment managers
-
Genomes, Prompts, and Shiny: What I Built During My Summer at Posit
Insights
-
{renv}, {rix}, rv, uvr, ir: An explosion of R package and environment managers
-
Genomes, Prompts, and Shiny: What I Built During My Summer at Posit
R in the Real World
R in Organizations
R in Academia
Tutorials
Resources
New Packages
📦 Keep up to date wtih CRANberries 📦
CRAN
-
{bones} 0.1.1: Content-Shaped Loading Placeholders for ‘shiny’ Outputs
-
{retroglyph} 0.0.9: A Trusted Mini-Agent to Reconstruct Individual Patient Data from Kaplan-Meier Images
-
dasklyr - dplyr front-end for Dask (
dask_connect/copy_to/ collect via reticulate). GitHub -
{ertte} 0.1.1: Exposure-Response Tools for Time-to-Event Models
-
{doubletrs} 0.1.0: Memory-Efficient Doublet Detection for Single-Cell RNA Sequencing
-
{VCFArrow} 0.9.0: Fast and Memory-Efficient Manipulation and Conversion of VCF Files
-
{treehunt} 0.0.2: Evolutionary Search for Optimal Node Combinations in Trees
-
{SynthesizerPlus} 0.2.9: Synthetic Data Generation with Copulas, Evaluation and Multi-Format I/O
-
{RTFBoost} 0.1.0: Robust Tree-Based Boosting for Functional Regression
-
{modelname} 0.1.0: Parse AI Model Names into Vendor, Family and Version
-
{knitroff} 0.1.0: Dynamic Reports in ‘troff’ with ‘knitr’
-
{fvfmR} 1.0.0: Chlorophyll Fluorescence (Fv/Fm) Analysis of Leaf Disc Images
-
{ClimateAnomaly} 1.0.0: Rainfall and Temperature Anomaly Indices for Climate Analysis
-
{actiplot} 0.1.0: Plotting Minute-Level Activity Data
-
{zukomp} 0.1.0: Portable Byte Compression with a Pluggable Codec Registry
-
{zucsv} 0.1.0: Read CSV Files Using the ‘zsv’ Parser
-
{rladybugdb} 0.4.4: R Interface to the ‘LadybugDB’ Embedded Graph Database
-
{networkformat} 0.1.2: Convert R Objects to Network Edgelists and Nodelists
-
{localdatasus} 0.2.0: Neighborhood-Level Data from Brazil’s Unified Health System
-
{ellmercodex} 0.2.0: ‘ChatGPT’ Plan Provider for ‘ellmer’
-
{lillardhaz} 1.0.0: Simultaneous-Equations Hazard/Probit Models with a Gaussian-Copula Correlation
-
{reactives} 0.1.0: Keyed Collections of ‘shiny’ Reactives
-
{CoopPostman} 0.1.0: Optimal Routing and Cost Allocation for the Chinese Postman Game
-
{writeLog} 0.1.0: Write Printed Output of R Objects to Log Files
-
{tabby} 0.0.1: Tidy Interfaces for Tabular Deep Learning
-
{simulab} 0.4.10: Simulates a Wide Variety of Data Shapes, Sizes and Distributions
-
{rjsf} 0.1.0: R Interface to Jump-Switch-Flow Simulation
-
{limestab} 0.1.0: Stable Local Interpretable Model-Agnostic Explanations (LIME, OptiLIME, BayLIME, ALIME)
-
{dsFedAte} 0.1.0: Server-Side Treatment Effect Computation for Federated Studies
-
{aradR} 0.2.0: Modern R Client and Toolkit for the Czech National Bank ARAD API
-
{trialfigs} 0.1.0: Efficacy and Safety Graphics for Clinical Review Packages
-
{RTrino} 0.1.0: ‘DBI’ Backend for ‘Trino’
-
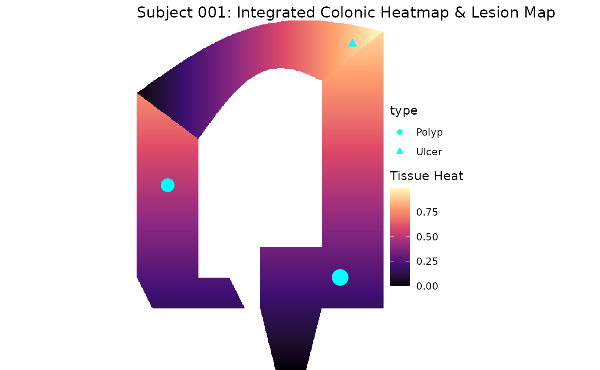
{ggcolonviz} 0.0.6: A ‘ggplot2’ Extension for Visualizing the Colon
-
{ggaltdata} 0.1.0: Data-Driven Alternative Text and Data Tables for ‘ggplot2’ Charts
-
{enviPathR} 1.0.1: Client for the ‘enviPath’ ‘RESTful’ API
-
{cam2model} 0.3.0: Preprocessing Trap Camera Data for Machine Learning Models
-
{publicdataau} 0.4.1: Australian Government Open Data from ‘publicdata.au’
-
{jekylldown} 0.3.4: Create, Build and Serve ‘Jekyll’ Websites from ‘R Markdown’ and ‘Quarto’
-
{frostlake} 0.1.0: ‘DBI’ Backend for the ‘Frostlake’ Database Engine
-
{sds} 0.3.0: Spatial Data Sources
-
{sampleone} 0.1.0: Survey Sampling Methods for Teaching and Practice
-
{rtemis.draw} 0.5.3: Schema-Driven Interactive Charts, Network Graphs, and Maps
-
{pnotp} 0.1.0: Client for the ‘PnotP’ Platform
-
{GreenManureR} 0.1.0: Green Manure Decomposition, Nutrient Release and Crop Response
-
{epidist} 1.0.0: Estimate Epidemiological Delay Distributions with ‘brms’
-
{foresightr} 0.1.1: Forecasts Chosen by What Would Have Worked
GitHub or Bitbucket or GitLab
Updated Packages
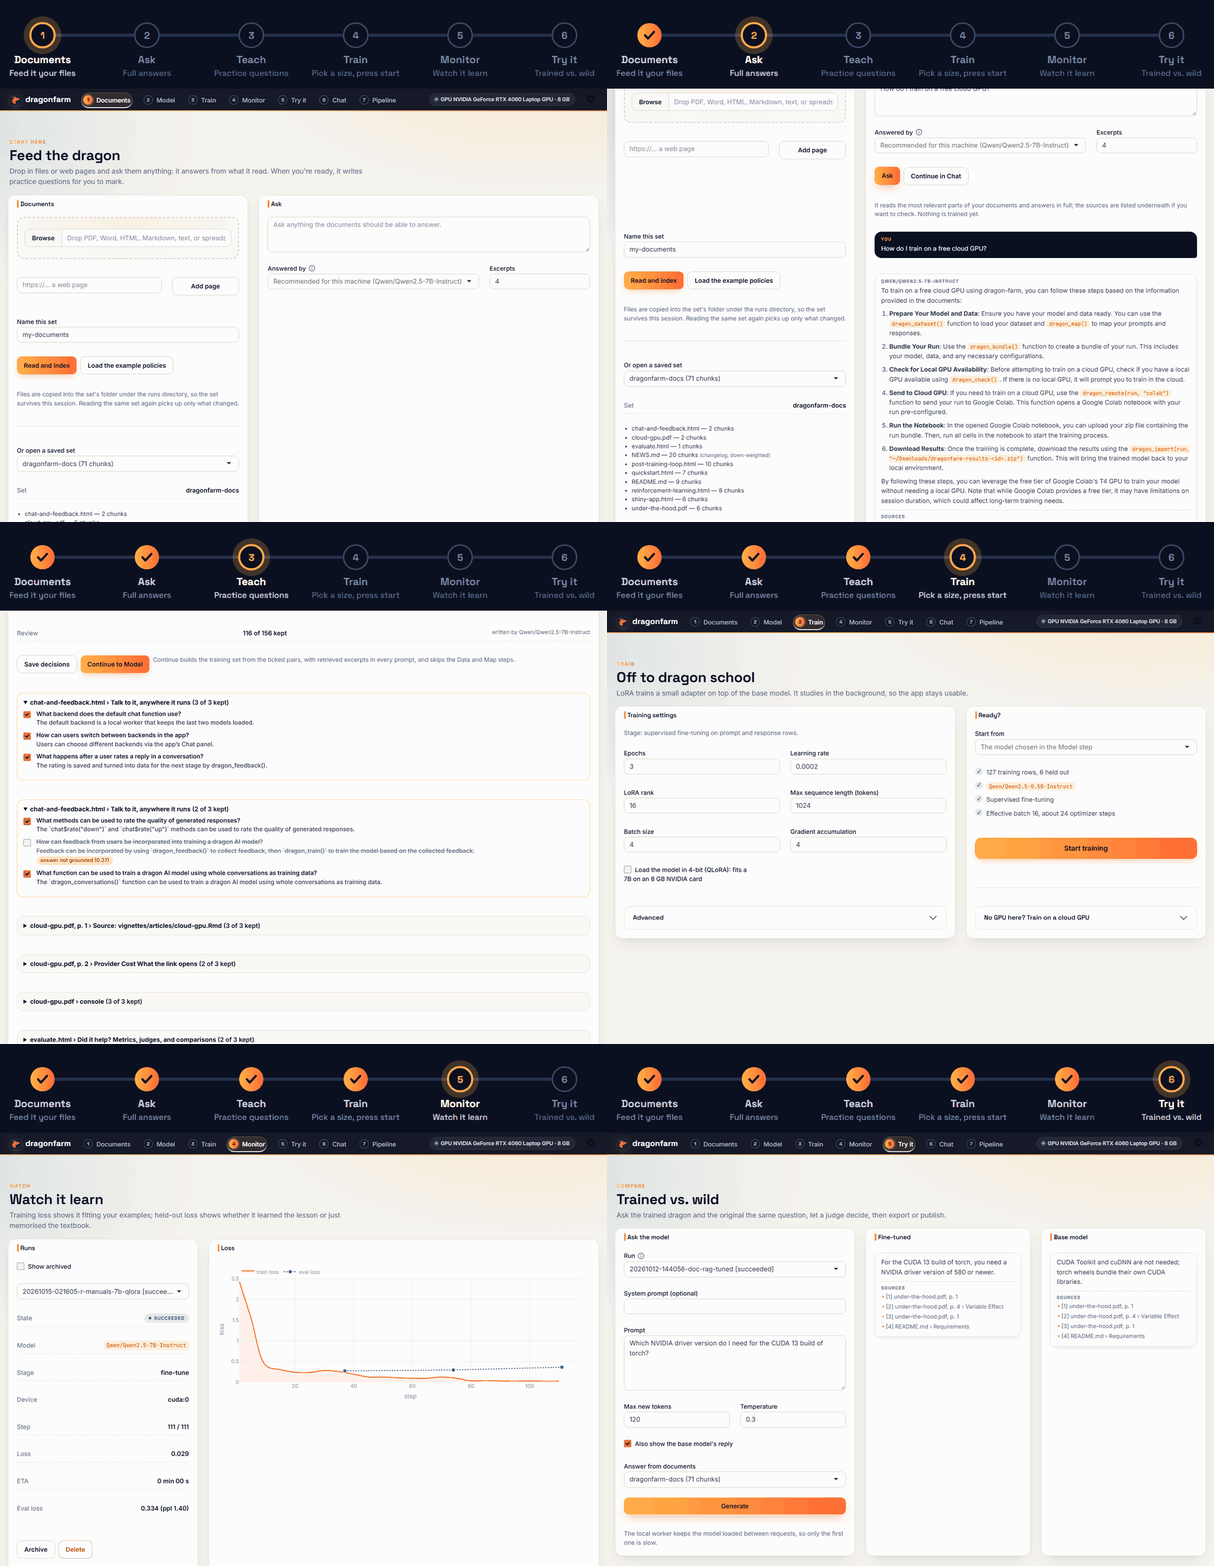
- Fine-tune your own model from R, starting from your documents - dragonfarm 0.4.0 writes the training data from your documents, fine-tunes a model on your own laptop, and keeps it grounded with built-in RAG. Raise your own dragon.
-
{sdmTMB} 1.1.0: Spatial and Spatiotemporal SPDE-Based GLMMs with ‘TMB’ - diffify
-
{newscatcheR} 0.1.3: Programmatically Collect Normalized News from (Almost) Any Website - diffify
-
{tbl.now} 1.2.0: Tidy Data and Workflow Layer for Epidemic Nowcasting - diffify
-
{rambur} 0.5.6: Design and Analysis of Intertidal Chamber Experiments - diffify
-
{phsopendata} 1.1.1: Extract from the Scottish Health and Social Care Open Data Platform - diffify
-
{babelmixr2} 0.1.12: Use ‘nlmixr2’ to Interact with Open Source and Commercial Software - diffify
-
{future.apply} 1.21.0: Apply Function to Elements in Parallel using Futures - diffify
-
{coinclp} 0.1.2: R Interface to the ‘COIN-OR’ ‘Clp’ Linear Programming Solver - diffify
-
{spatialrisk} 0.8.4: Spatial Concentration and Radius-Based Risk Calculations - diffify
-
{sicher} 0.2.0: Runtime Type Checking - diffify
-
{AMR} 3.1.0: Antimicrobial Resistance Data Analysis - diffify
-
{simFastBOIN} 2.1.0: Fast Simulation of Bayesian Optimal Interval Designs for Phase I Trials - diffify
-
{r4ss} 1.44.1: Compatibility Notice for Stock Synthesis Tools - diffify
-
{DoseFinding} 1.4-2: Planning and Analyzing Dose Finding Experiments - diffify
-
{zephyr} 0.1.4: Structured Messages and Options - diffify
-
{yahoofinancer} 0.6.1: Fetch Data from Yahoo Finance API - diffify
-
{Surrogate} 3.4.3: Evaluation of Surrogate Endpoints in Clinical Trials - diffify
-
{specr} 1.1.0: Conducting and Visualizing Specification Curve Analyses - diffify
-
{ggimage} 0.3.8: Use Images in ‘ggplot2’ - diffify
-
{ethnobotanyR} 0.3.0: Ethnobotanical Analysis, Decision-Framing, and TEK Modeling - diffify
-
{vistributions} 0.2.1: Visualize Probability Distributions - diffify
-
{rfm} 0.5.0: Recency, Frequency and Monetary Value Analysis - diffify
-
{PFIM} 8.0.1: Population Fisher Information Matrix - diffify
-
{bmm} 1.4.1: Easy and Accessible Bayesian Measurement Models Using ‘brms’ - diffify
-
{bayestestR} 0.20.0: Understand and Describe Bayesian Models and Posterior Distributions - diffify
-
{ggDNAvis} 1.1.0: ‘ggplot2’-Based Tools for Visualising DNA Sequences and Modifications - diffify
-
{tidyweather} 0.3.3: Analysis the Weather Data for Agriculture - diffify
-
{Spower} 0.7: Power Analyses using Monte Carlo Simulations - diffify
-
{lime} 0.5.5: Local Interpretable Model-Agnostic Explanations - diffify
-
{logr} 1.4.1: Creates Log Files - diffify
-
{flocker} 1.1-0: Flexible Occupancy Estimation with Stan - diffify
-
{dsp} 1.7.0: Dynamic Shrinkage Process and Change Point Detection - diffify
-
{future} 1.80.0: Unified Parallel and Distributed Processing in R for Everyone - diffify
-
{shinyGovstyle} 0.3.0: Custom Gov Style Inputs for Shiny - diffify
-
{officedown} 0.4.3: Enhanced ‘R Markdown’ Format for ‘Word’ and ‘PowerPoint’ - diffify
-
{rfacebookstat} 2.17.0: Load Data from Facebook API Marketing - diffify
-
{gdtools} 0.5.2: Font Metrics and Font Management Utilities for R Graphics - diffify
-
{collegeScorecard} 0.3.0: US College Scorecard Data - diffify
-
{parameters} 0.30.0: Processing of Model Parameters - diffify
-
{JMbayes2} 0.6-5: Extended Joint Models for Longitudinal and Time-to-Event Data - diffify
-
{PredPsych} 0.6: Predictive Approaches in Psychology - diffify
-
{eVCGsampler} 1.2.0: VCG Sampling using Energy-Based Covariate Balancing - diffify
-
{FeNEU} 3.0.3: Routines for Evaluating Forest Inventory Data - diffify
-
{semPower} 2.2.0: Power Analyses for SEM - diffify
-
{multiplex} 4.2: Algebraic Tools for the Analysis of Multiple Social Networks - diffify
-
{togglr} 1.0.0: Client for the ‘Toggl Track’ API - diffify
-
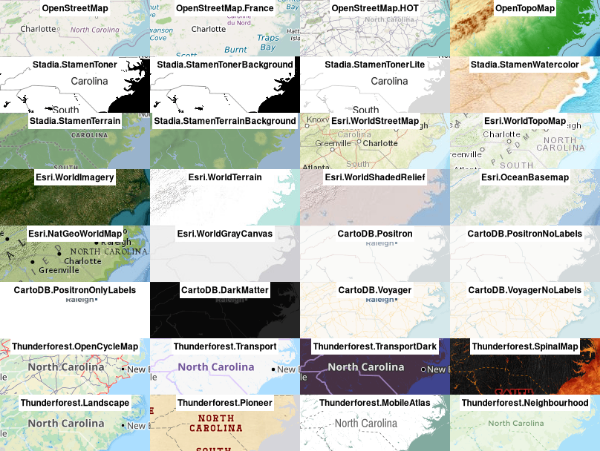
{maptiles} 0.13.0: Download and Display Map Tiles - diffify
-
{rbmi} 1.7.0: Reference Based Multiple Imputation - diffify
-
{PhytoIn} 0.2.1: Vegetation Analysis and Forest Inventory - diffify
-
{DNNSIM} 0.2.1: Single-Index Neural Network for Skewed Heavy-Tailed Data - diffify
-
{gt} 1.4.0: Easily Create Presentation-Ready Display Tables - diffify
- {ecr} 2.1.1.1: Evolutionary Computation in R - diffify
-
{conformalForecast} 0.2.0: Conformal Prediction Methods for Multistep-Ahead Time Series Forecasting - diffify
-
{FastSurvival} 1.2.0: Fast Survival Analysis and Simulation for Clinical Trials - diffify
-
{roger} 1.6-0: Automated Grading of R Scripts - diffify
-
{essentialstools} 0.1.8: Datasets and Utilities for Essentials of Statistics for the Behavioral Sciences - diffify
-
{SemNetDictionaries} 0.3.0: Dictionaries for the ‘SemNetCleaner’ Package - diffify
-
{PP} 1.0.0: Person Parameter Estimation - diffify
-
{linearModel} 1.1.1: Linear Model Functions - diffify
-
{officer} 0.7.7: Manipulation of Microsoft Word and PowerPoint Documents - diffify
-
{dbSpatial} 0.1.3: Spatial Data Operations for Database-Backed Geometries - diffify
-
{Rdune} 1.1.2: ‘Creates Color Palettes Inspired by Dune’ - diffify
-
{BOLDNODE} 1.0.1: Search and Explore BOLD Data Packages Efficiently - diffify
-
{bild} 1.3-0: A Package for BInary Longitudinal Data - diffify
-
{AV1R} 0.1.4.1: ‘AV1’ Video Encoding for Biological Microscopy Data - diffify
-
{uteals} 0.0.6: Shared Utilities to Extend the ‘teal’ Modules - diffify
-
{gpuinfo} 0.2.0: Lightweight Hardware and GPU Compute Detection - diffify
-
{curl} 8.1.0: A Modern and Flexible Web Client for R - diffify
-
{BayesSIM} 2.0.0: Integrated Interface of Bayesian Single Index Models using ‘nimble’ - diffify
-
{WaterBalanceR} 0.1.22: Calculate High Resolution Water Balance of Starch Potatoes - diffify
-
{gert} 2.5.0: Simple Git Client for R - diffify
-
{melodi} 1.2.0: Download Insee French Institute of Statistics Open Data - diffify
-
{tidyllm} 0.7.1: Tidy Integration of Large Language Models - diffify
-
{pharmaverseadam} 1.4.0: ADaM Test Data for the ‘Pharmaverse’ Family of Packages - diffify
-
{pwrss} 1.3.3: Statistical Power, Sample Size, and Detectable Effect Calculations - diffify
-
{matrixprofiler} 0.1.12: Matrix Profile for R - diffify
-
{CoRpower} 1.0.5: Power Calculations for Assessing Correlates of Risk in Clinical Efficacy Trials - diffify
-
{webchem} 2.0.0: Chemical Information from the Web - diffify
-
{lambda.r} 1.2.6: Modeling Data with Functional Programming - diffify
-
{fields} 18.0: Tools for Spatial Data - diffify
-
{tidyrates} 0.0.2: Tidy Epidemiological Rates - diffify
-
{Rtinycc} 0.1.16: Builds the ‘TinyCC’ Command-Line Interface and Library for ‘C’ Scripting in ‘R’ - diffify
-
{RQuantLib} 0.4.29: R Interface to the ‘QuantLib’ Library - diffify
-
{junco} 0.1.7: Create Common Tables and Listings Used in Clinical Trials - diffify
-
{DTEAssurance} 1.3.0: Assurance Methods for Clinical Trials with a Delayed Treatment Effect - diffify
-
{contfrac} 1.1-13: Continued Fractions - diffify
- {pipeflow} 0.5.0: Fast Interactive Data Analysis Pipelines - diffify
Videos and Podcasts
Shiny Apps
R Internationally
-
[Más Allá del Código: muestra abierta de los proyectos de nuestros campeon(a e)s](https://ropensci.org/es/commcalls/mas-alla-del-codigo-2026/)
R Project Updates
Updates from R Core:
Upcoming Events in 3 Months
Events in 3 Months:
Connect
Join the Data Science Learning Community
rtistry
A little bit of #Rtistry 🎨 #RStats #ggplot2 #GenArtClub #CreativeCoding
— Nicola Rennie (@nrennie.bsky.social) October 14, 2026 at 4:23 PM
[image or embed]