Live
-
{{ is_pkg(link.U) }}{{ link.T }} {{ get_host(link.U) }} - {{ link.N }} ( {{ get_host(link.U) }} )
{{ is_pkg(link.U) }}{{ link.T }} {{ get_host(link.U) }}( {{ get_host(link.U) }} )
{{ item.date }}
-
{{ is_pkg(link.U) }}{{ link.T }} {{ get_host(link.U) }} - {{ link.N }}
( {{ get_host(link.U) }} ){{ is_pkg(link.U) }}{{ link.T }} {{ get_host(link.U) }}
( {{ get_host(link.U) }} )
R Weekly 2024-W18 R 4.4.0, bslib snippet, tailoring Shiny
This week’s release was curated by Eric Nantz, with help from the R Weekly team members and contributors.
Highlight
Insights
R in the Real World
R in Academia
Resources
New Packages
CRAN
-
{adepro} 4.1.0: A ‘shiny’ Application for the (Audio-)Visualization of Adverse Event Profiles
-
{sqltargets} 0.0.1: Targets Extension for ‘SQL’ Queries
-
{plotcli} 0.1.0: Command Line Interface Plotting
-
{mlr3summary} 0.1.0: Model and Learner Summaries for ‘mlr3’
-
{prediction} 0.3.17: Tidy, Type-Safe ‘prediction()’ Methods
-
{BayesSurvive} 0.0.1: Bayesian Survival Models for High-Dimensional Data
-
{tidylda} 0.0.5: Latent Dirichlet Allocation Using ‘tidyverse’ Conventions
-
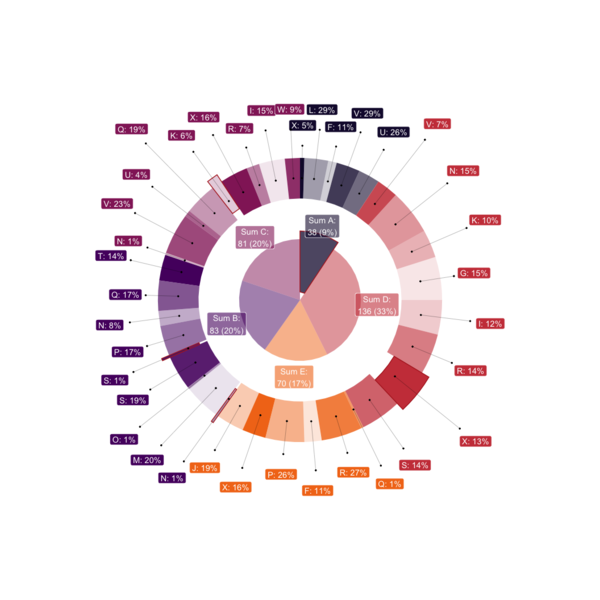
{donutsk} 0.1.1: Construct Advanced Donut Charts
-
{CreditRisk} 0.1.7: Evaluation of Credit Risk with Structural and Reduced Form
-
{yodel} 1.0.0: A General Bayesian Model Averaging Helper
Updated Packages
-
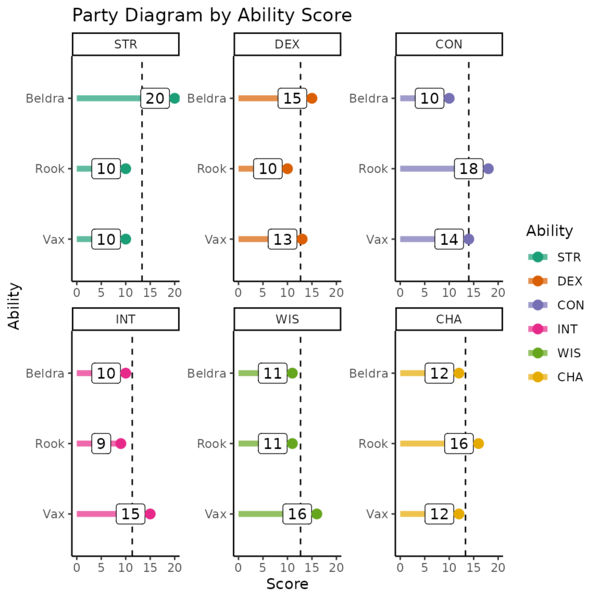
{dndR} 1.3.1: Dungeons & Dragons Functions for Players and Dungeon Masters - diffify
-
{tth} 4.16-0: TeX-to-HTML/MathML Translators TtH/TtM - diffify
-
{csdata} 2024.4.26: Structural Data for Norway - diffify
-
{breakfast} 2.4: Methods for Fast Multiple Change-Point/Break-Point Detection and Estimation - diffify
-
{TidyDensity} 1.4.0: Functions for Tidy Analysis and Generation of Random Data - diffify
-
{apcluster} 1.4.13: Affinity Propagation Clustering - diffify
-
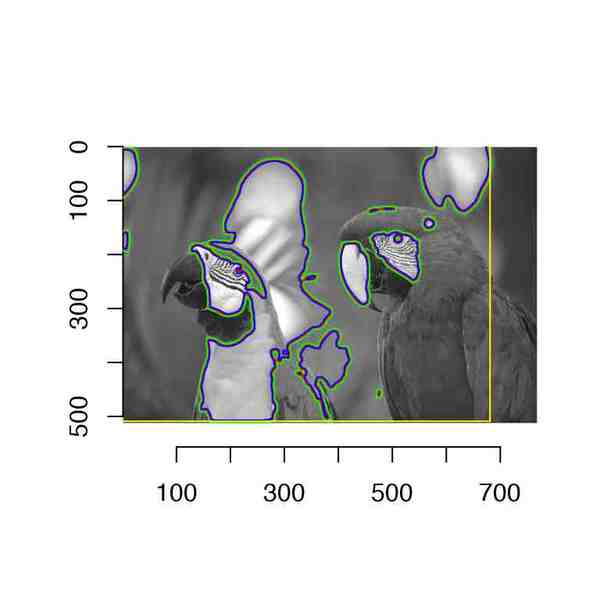
{imager} 1.0.1: Image Processing Library Based on ‘CImg’ - diffify
-
{arulesViz} 1.5.3: Visualizing Association Rules and Frequent Itemsets - diffify
-
{UBCRM} 1.0.3: Simulate and Conduct Dose-Escalation Phase I Studies - diffify
-
{stplanr} 1.2.0: Sustainable Transport Planning - diffify
-
{RcppSpdlog} 0.0.17: R and C++ Interfaces to ‘spdlog’ C++ Header Library for Logging - diffify
-
{LearnPCA} 0.3.4: Functions, Data Sets and Vignettes to Aid in Learning Principal Components Analysis (PCA) - diffify
-
{runMCMCbtadjust} 1.1.0: Runs Monte Carlo Markov Chain - With Either ‘JAGS’, ‘nimble’ or ‘greta’ - While Adjusting Burn-in and Thinning Parameters - diffify
-
{RepeatedHighDim} 2.3.0: Methods for High-Dimensional Repeated Measures Data - diffify
-
{fs} 1.6.4: Cross-Platform File System Operations Based on ‘libuv’ - diffify
-
{stringmagic} 1.1.1: Character String Operations and Interpolation, Magic Edition - diffify
-
{xopen} 1.0.1: Open System Files, ‘URLs’, Anything - diffify
-
{webfakes} 1.3.1: Fake Web Apps for HTTP Testing - diffify
-
{RStoolbox} 1.0.0: Remote Sensing Data Analysis - diffify
-
{debugme} 1.2.0: Debug R Packages - diffify
-
{chevron} 0.2.6: Standard TLGs for Clinical Trials Reporting - diffify
-
{causact} 0.5.5: Fast, Easy, and Visual Bayesian Inference - diffify
-
{cranlike} 1.0.3: Tools for ‘CRAN’-Like Repositories - diffify
-
{clinDataReview} 1.5.1: Clinical Data Review Tool - diffify
-
{cliapp} 0.1.2: Create Rich Command Line Applications - diffify
-
{brio} 1.1.5: Basic R Input Output - diffify
-
{mongolite} 2.8.0: Fast and Simple ‘MongoDB’ Client for R - diffify
-
{xslt} 1.4.5: Extensible Style-Sheet Language Transformations - diffify
-
{SimDesign} 2.15.1: Structure for Organizing Monte Carlo Simulation Designs - diffify
-
{crew.cluster} 0.3.1: Crew Launcher Plugins for Traditional High-Performance Computing Clusters - diffify
-
{ShinyItemAnalysis} 1.5.1: Test and Item Analysis via Shiny - diffify
-
{spc} 0.6.8: Statistical Process Control – Calculation of ARL and Other Control Chart Performance Measures - diffify
-
{survival} 3.6-4: Survival Analysis - diffify
-
{AgroR} 1.3.6: Experimental Statistics and Graphics for Agricultural Sciences - diffify
-
{flightsbr} 0.4.1: Download Flight and Airport Data from Brazil - diffify
-
{emayili} 0.8.0: Send Email Messages - diffify
-
{randtests} 1.0.2: Testing Randomness in R - diffify
-
{labelled} 2.13.0: Manipulating Labelled Data - diffify
-
{grattanInflators} 0.5.3: Inflators for Australian Policy Analysis - diffify
-
{SIAmodules} 0.1.1: Modules for ‘ShinyItemAnalysis’ - diffify
-
{shinyDatetimePickers} 1.2.0: Some Datetime Pickers for ‘Shiny’ - diffify
-
{shinylight} 1.2: Web Interface to ‘R’ Functions - diffify
-
{ern} 2.0.0: Effective Reproduction Number Estimation - diffify
-
{memoiR} 1.2-9: R Markdown and Bookdown Templates to Publish Documents - diffify
-
{BMRMM} 1.0.1: An Implementation of the Bayesian Markov (Renewal) Mixed Models - diffify
-
{openssl} 2.1.2: Toolkit for Encryption, Signatures and Certificates Based on OpenSSL - diffify
-
{flexsurv} 2.3: Flexible Parametric Survival and Multi-State Models - diffify
Videos and Podcasts
Gist & Cookbook
Shiny Apps
Tutorials
R Project Updates
Updates from R Core:
Upcoming Events in 3 Months
Events in 3 Months:
-
Decade of Data: Celebrating 10 Years of Innovation at the New York R Conference
-
Optimal policy learning based on causal machine learning in R workshop
-
Unlocking Financial Insights: Join Us at the R Finance Conference
-
R/Medicine Coming June 10-14, 2024 – Call for Abstracts Open – Keynotes Announced
Jobs
💼 Explore Jobs & Gigs Board on RStudio Community 💼