Live
-
{{ is_pkg(link.U) }}{{ link.T }} {{ get_host(link.U) }} - {{ link.N }} ( {{ get_host(link.U) }} )
{{ is_pkg(link.U) }}{{ link.T }} {{ get_host(link.U) }}( {{ get_host(link.U) }} )
{{ item.date }}
-
{{ is_pkg(link.U) }}{{ link.T }} {{ get_host(link.U) }} - {{ link.N }}
( {{ get_host(link.U) }} ){{ is_pkg(link.U) }}{{ link.T }} {{ get_host(link.U) }}
( {{ get_host(link.U) }} )
R Weekly 2023-W35 S7 0.1.0, Template Files, Web APIs
This week’s release was curated by Eric Nantz, with help from the R Weekly team members and contributors.
Highlight
-
{S7} 0.1.0: An Object Oriented System Meant to Become a Successor to S3 and S4
Insights
-
Do more with Excel with openxlsx2 v1.0 Create cool things in Excel
R in the Real World
R in Academia
Resources
New Packages
CRAN
-
{modeldatatoo} 0.2.1: More Data Sets Useful for Modeling Examples
-
{hdd} 0.1.1: Easy Manipulation of Out of Memory Data Sets
-
{TrialEmulation} 0.0.3.2: Causal Analysis of Observational Time-to-Event Data
-
{RTLknitr} 1.0.0: Right to Left Dynamic Documents Using ‘knitr’
-
{disk.frame} 0.8.3: Larger-than-RAM Disk-Based Data Manipulation Framework
-
{spNetwork} 0.4.3.8: Spatial Analysis on Network
-
{syllogi} 1.0.1: Collection of Data Sets for Teaching Purposes
-
{periscope2} 0.1.3: Enterprise Streamlined ‘shiny’ Application Framework Using ‘bs4Dash’
-
{h3lib} 0.1.0: Exposes the ‘Uber’ ‘H3’ Library to R Packages
-
{S7} 0.1.0: An Object Oriented System Meant to Become a Successor to S3 and S4
-
{LifemapR} 1.0.4: Data Visualisation on ‘Lifemap’ Tree
-
{artpack} 0.1.0: Creates Generative Art Data
-
{gitgadget} 0.8.1: ‘Rstudio’ Addin for Version Control and Assignment Management using Git
-
{blsBandit} 0.1: Data Viewer for Bureau of Labor Statistics Data
-
{shinyCox} 1.0.1: Create ‘shiny’ Applications for Cox Proportional Hazards Models
-
{dartRverse} 0.49: Install and Load the ‘dartRverse’ Suits of Packages
-
{deepRstudio} 0.0.4: Seamless Language Translation in ‘RStudio’ using ‘DeepL’ API and ‘Rstudioapi’
-
{treeDbalance} 1.0.1: Computation of 3D Tree Imbalance
-
{tagr} 1.0.0: Tagging and Organizing Objects in R
-
{roxyglobals} 1.0.0: ‘Roxygen2’ Global Variable Declarations
-
{bootwar} 0.1.0: Nonparametric Bootstrap Test with Pooled Resampling Card Game
-
{rmass2} 0.0.0.1: Repeated Measures with Attrition: Sample Sizes and Power Levels for 2 Groups
-
{brms.mmrm} 0.0.2: Bayesian MMRMs using ‘brms’
-
{scriptloc} 1.0.0: Get the Location of the R Script that is Being Sourced/Executed
-
{GWalkR} 0.1.2: Interactive Exploratory Data Analysis Tool
-
{micromodal} 1.0.0: Create Simple and Elegant Modal Dialogs in ‘shiny’
-
{DominoDataR} 0.2.3: ‘Domino Data R SDK’
-
{statcanR} 0.2.6: Client for Statistics Canada’s Open Economic Data
-
{VisCollin} 0.1.1: Visualizing Collinearity Diagnostics
-
{osmclass} 0.1.3: Classify Open Street Map Features
-
{graposas} 1.0.0: Graphical Approach Optimal Sample Size
-
{giacR} 1.0.0: Interface to the Computer Algebra System ‘Giac’
-
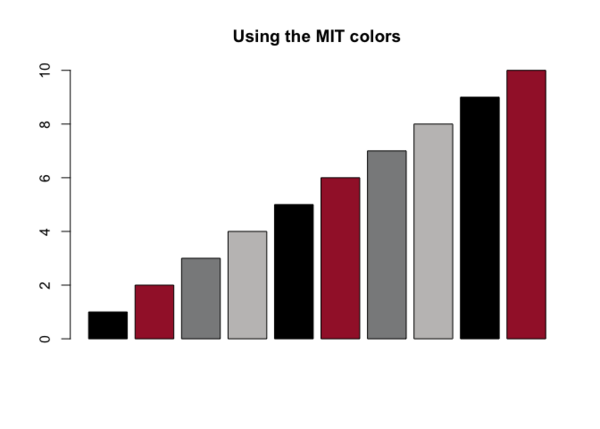
{unicol} 0.1.0: The Colors of your University
-
{pfr} 1.0.0: Interface to the ‘C++’ Library ‘Pf’
-
{aifeducation} 0.2.0: Artificial Intelligence for Education
-
{tidyhte} 1.0.2: Tidy Estimation of Heterogeneous Treatment Effects
-
{packagepal} 0.1.0: Guidelines and Checklists for Building CRAN-Worthy Packages
-
{rgho} 3.0.1: Access WHO Global Health Observatory Data from R
-
{visit} 2.2: Vaccine Phase I Design with Simultaneous Evaluation of Immunogenicity and Toxicity
Updated Packages
-
{mirai.promises} 0.2.0: Make Mirai Promises in Shiny and Plumber Pipelines
-
{tmbstan} 1.0.91: MCMC Sampling from ‘TMB’ Model Object using ‘Stan’ - diffify
-
{shinytest2} 0.3.1: Testing for Shiny Applications - diffify
-
{rlistings} 0.2.4: Clinical Trial Style Data Readout Listings - diffify
-
{rworkflows} 0.99.12: Test, Document, Containerise, and Deploy R Packages - diffify
-
{Gmisc} 3.0.3: Descriptive Statistics, Transition Plots, and More - diffify
-
{holodeck} 0.2.2: A Tidy Interface for Simulating Multivariate Data - diffify
-
{PatientProfiles} 0.3.1: Identify Characteristics of Patients in the OMOP Common Data Model - diffify
-
{pbr} 0.0.2: Find a Cold One Near You - diffify
-
{mvtnorm} 1.2-3: Multivariate Normal and t Distributions - diffify
-
{modules} 0.12.0: Self Contained Units of Source Code - diffify
-
{tidyseurat} 0.7.2: Brings Seurat to the Tidyverse - diffify
-
{piecepackr} 1.13.6: Board Game Graphics - diffify
-
{mapplots} 1.5.2: Data Visualisation on Maps - diffify
-
{perm} 1.0-0.4: Exact or Asymptotic Permutation Tests - diffify
-
{ggDoubleHeat} 0.1.2: A Heatmap-Like Visualization Tool - diffify
-
{pandoc} 0.2.0: Manage and Run Universal Converter ‘Pandoc’ from ‘R’ - diffify
-
{Rcmdr} 2.9-0: R Commander - diffify
-
{qbr} 1.2.3: Access the ‘Quickbase’ JSON API - diffify
-
{fplyr} 1.3.0: Apply Functions to Blocks of Files - diffify
-
{dreamerr} 1.3.0: Error Handling Made Easy - diffify
-
{rsample} 1.2.0: General Resampling Infrastructure - diffify
Videos and Podcasts
Tutorials
R Project Updates
Updates from R Core:
Call for Participation
- rOpenSci Call for Champions and Mentors - Applications due September 4, 2023.
Upcoming Events in 3 Months
Events in 3 Months:
Jobs
💼 Explore Jobs & Gigs Board on RStudio Community 💼
rtistry
Quotes of the Week
When you use the awesome #Barbie theme by @MatthewBJane in #RStats - you have to go all the way and use Barbie icons instead of dots in the #ggplot! The audience might not spot it at first sight … but when they do … pic.twitter.com/7CWlOYsFly
— Tom Broekel (@TBroekel) August 24, 2023
My life loves backpacking so we try to go on some adventures every summer. She always records with Garmin. So I thought, #rstats it up :) #GlacierNationalPark #rspatial pic.twitter.com/B5RM9MDCT4
— Josh Erickson (@joshualerickson) August 19, 2023