Live
-
{{ is_pkg(link.U) }}{{ link.T }} {{ get_host(link.U) }} - {{ link.N }} ( {{ get_host(link.U) }} )
{{ is_pkg(link.U) }}{{ link.T }} {{ get_host(link.U) }}( {{ get_host(link.U) }} )
{{ item.date }}
-
{{ is_pkg(link.U) }}{{ link.T }} {{ get_host(link.U) }} - {{ link.N }}
( {{ get_host(link.U) }} ){{ is_pkg(link.U) }}{{ link.T }} {{ get_host(link.U) }}
( {{ get_host(link.U) }} )
R Weekly 2023-W04 {englishfootball} database, Shiny for R & Python, 2023 R Conferences
This week’s release was curated by Ryo Nakagawara, with help from the R Weekly team members and contributors.
Highlight
Insights
R in the Real World

R in Academia
- Chan, C. (2023) grafzahl: fine-tuning Transformers for text data from within R. Computational Communication Research (Accepted) / CRAN
Resources
-
Reference guide for commonly used functions in education research data wrangling
-
R-SVN CI tool: Mirror of the R svn with CI for testing patches.
New Packages
CRAN
- {pirouette} 1.6.6: Create a Bayesian Posterior from a Phylogeny
- {stops} 1.0-1: Structure Optimized Proximity Scaling
- {prqlr} 0.1.0: R Bindings for the ‘prql-compiler’ Rust Library
- {ggplate} 0.0.1: Create Layout Plots of Biological Culture Plates and Microplates
- {CopernicusMarine} 0.0.3: Search Download and Handle Data from Copernicus Marine Service Information
- {blindreview} 1.0.1: Blind Review Using Forward Search Procedures
- {mathml} 0.5: Translate R Expressions to ‘MathML’ and ‘LaTeX’/’MathJax’
- {df2yaml} 0.3.0: Convert Dataframe to ‘YAML’
- {RSP} 0.1: ‘shiny’ Applications for Statistical and Psychometric Analysis
- {readmet} 1.6.6: Read some less Popular Formats Used in Meteorology
- {symphony} 0.1.1: Efficient and Precise Single-Cell Reference Atlas Mapping
- {sca} 0.9-1: Simple Component Analysis
- {conText} 1.4.2: ‘a la Carte’ on Text (ConText) Embedding Regression Data, Plus the Empirical Likelihood Ratio for F(T)
- {scenes} 0.1.0: Switch Between Alternative ‘shiny’ UIs
- {parquetize} 0.5.0: Convert Files to Parquet Format
- {factset.protobuf.stachextensions} 1.0.3: ‘FactSet’ ‘STACH’ Extensions Package
- {fabisearch} 0.0.4.5: Change Point Detection in High-Dimensional Time Series Networks
- {rKIN} 0.3.0: (Kernel) Isotope Niche Estimation
- {hmmTMB} 1.0.1: Fit Hidden Markov Models using Template Model Builder
- {roxytest} 0.0.2: Various Tests with ‘roxygen2’
- {plantTracker} 1.0.1: Extract Demographic and Competition Data from Fine-Scale Maps
- {connectwidgets} 0.2.0: Organize and Curate Your Content Within ‘Posit Connect’
- {BTSR} 0.1.4: Bounded Time Series Regression
- {azlogr} 0.0.4: Logging in ‘R’ and Post to ‘Azure Log Analytics’ Workspace
- {triact} 0.2.0: Analyzing the Lying Behavior of Cows from Accelerometer Data
- {sfdep} 0.2.3: Spatial Dependence for Simple Features
- {em} 1.0.0: Generic EM Algorithm
GitHub or Bitbucket
- {blog2newsletter} 0.0.1: A package to help push blog posts out to subscribers as an email newsletter.
- {youtubeR} 0.1.0: A package for interacting with the Youtube Data API.
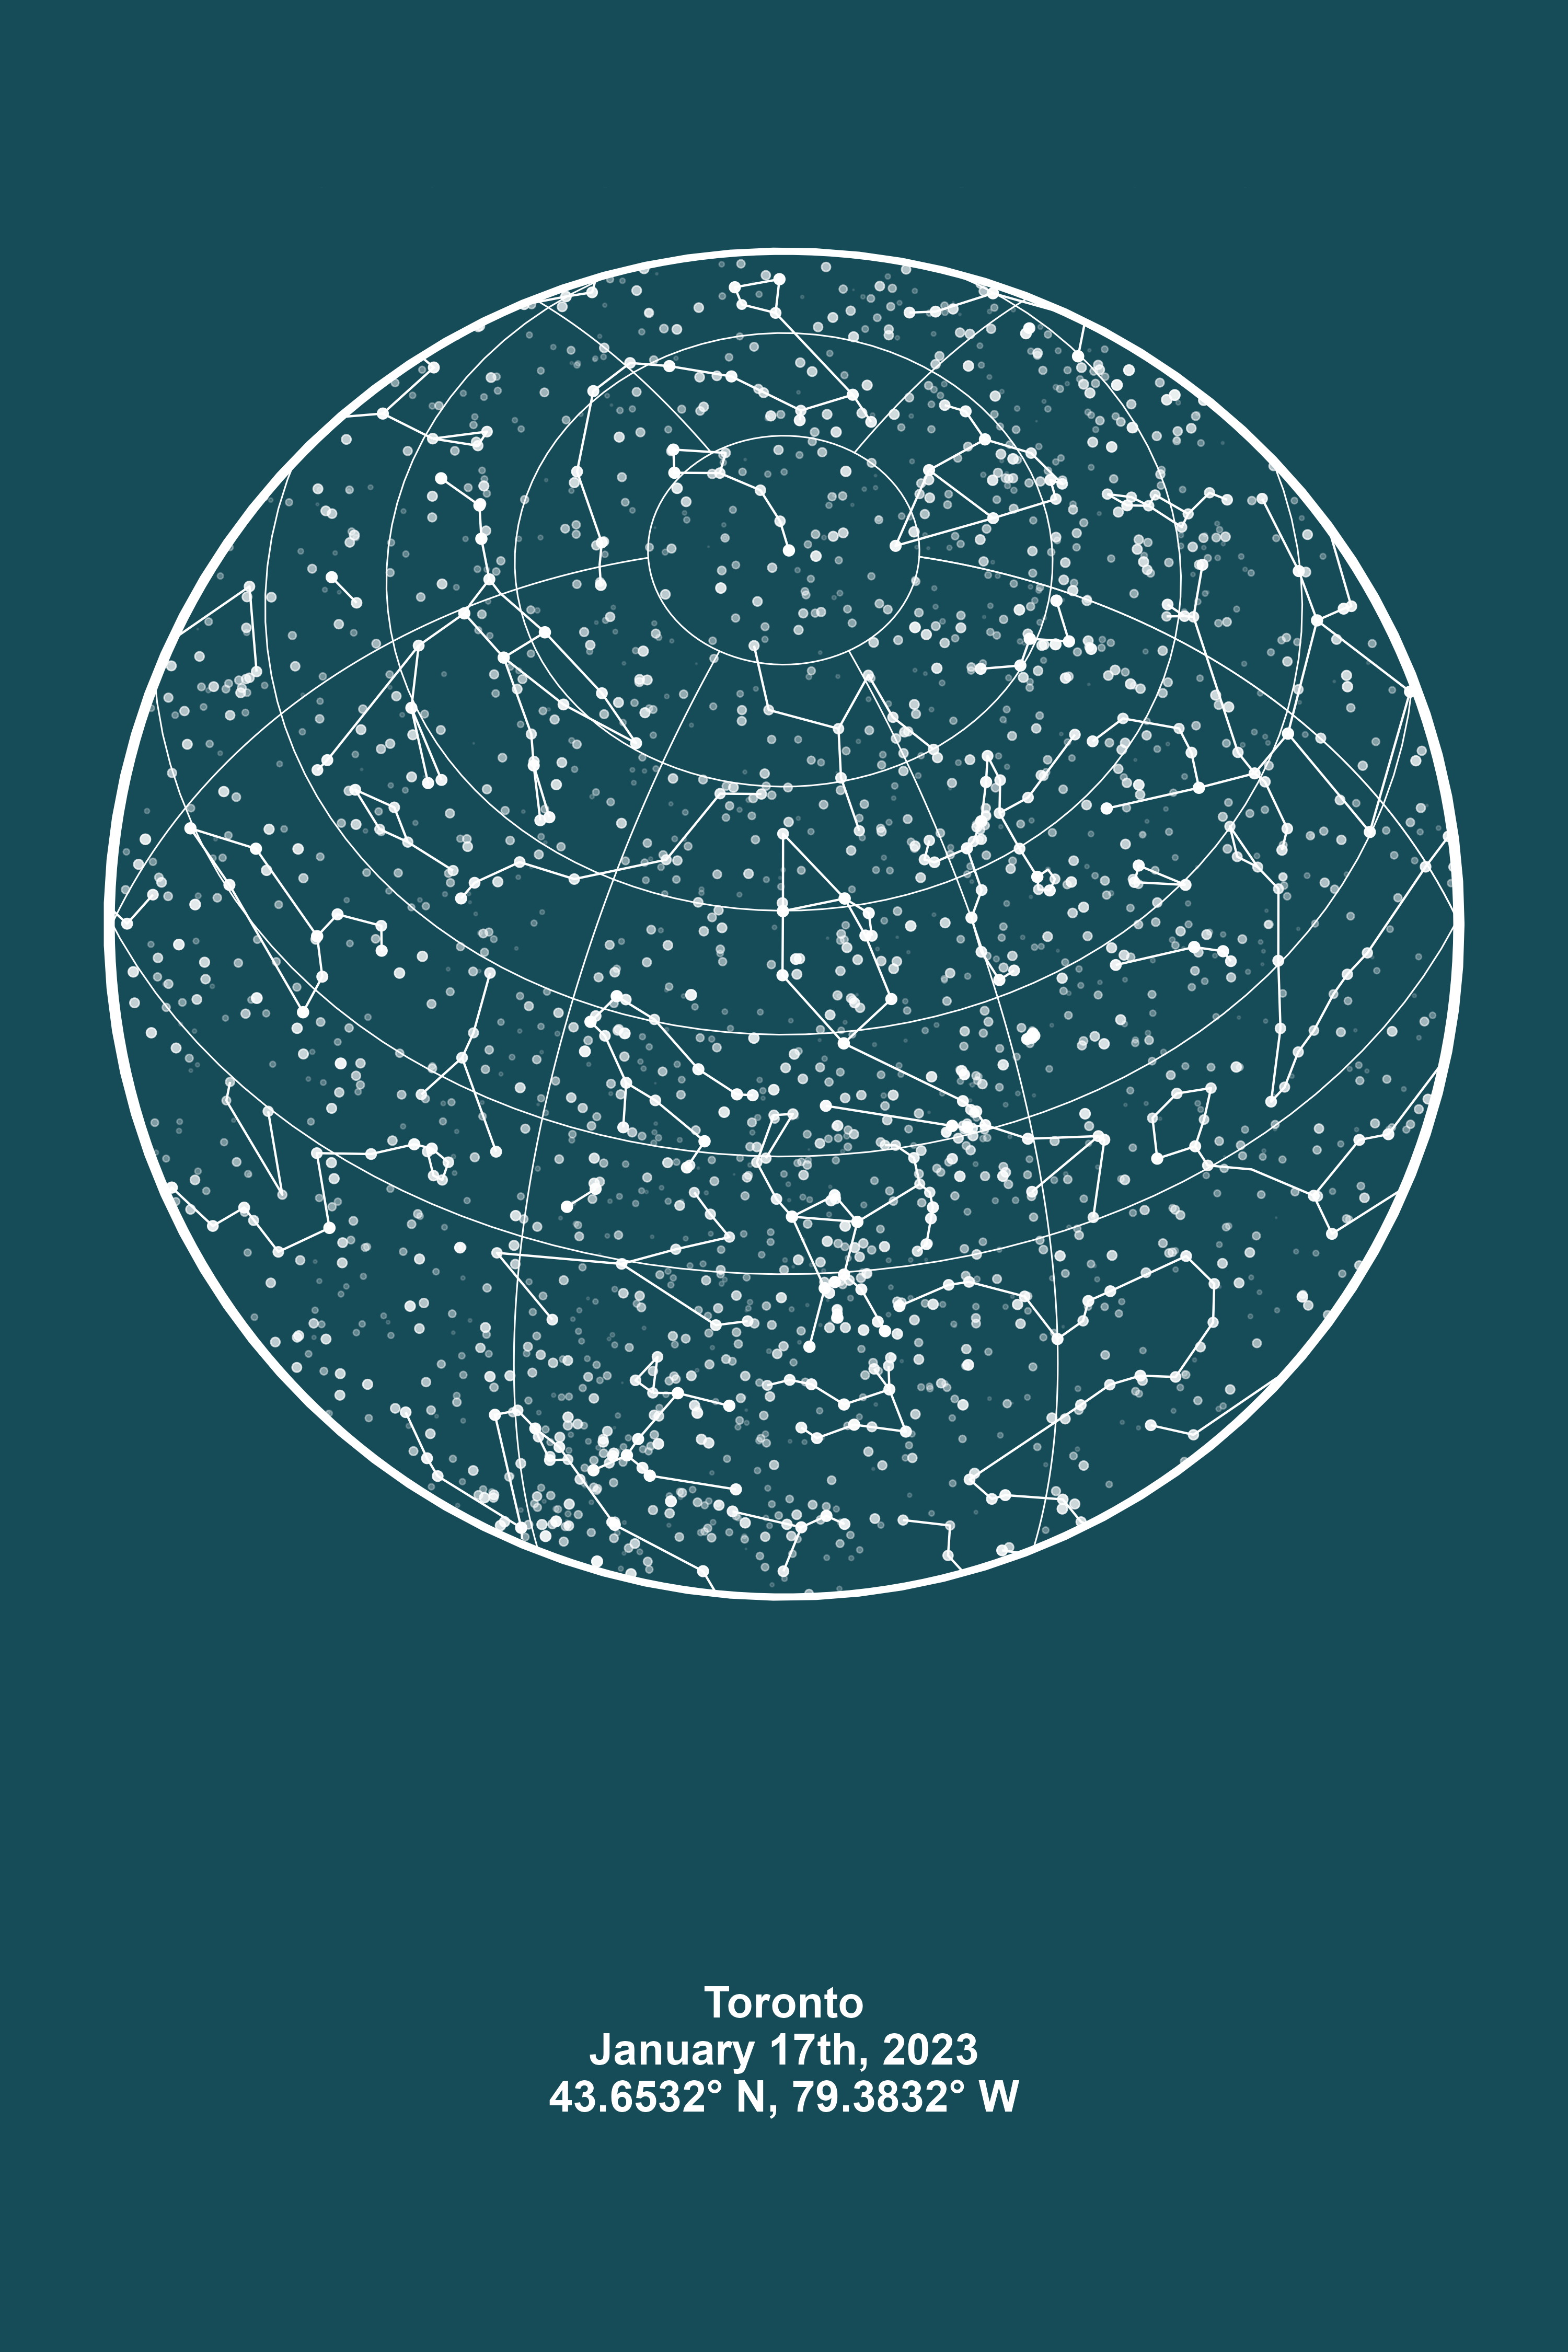
- {starBliss} 0.1.0: Create beautiful, print quality maps of the night sky in R.

Updated Packages
- {mirai} 0.7.2: Minimalist Async Evaluation Framework for R.
- {polars} 0.4.2: Bring polars to R.
- {MexBrewer} 0.0.2: Color Palettes Inspired by Works Mexican Muralists.
- {flextable} 0.8.4: Functions for Tabular Reporting - diffify
- {visachartR} 2.2.0: Wrapper for ‘Visa Chart Components’ - diffify
- {rmarkdown} 2.20: Dynamic Documents for R - diffify
- {tiledb} 0.18.0: Universal Storage Engine for Sparse and Dense Multidimensional Arrays - diffify
- {postdoc} 1.2.0: Minimal and Uncluttered Package Documentation - diffify
- {rgl} 1.0.1: 3D Visualization Using OpenGL - diffify
- {cartography} 3.1.3: Thematic Cartography - diffify
- {highlight} 0.5.1: Syntax Highlighter - diffify
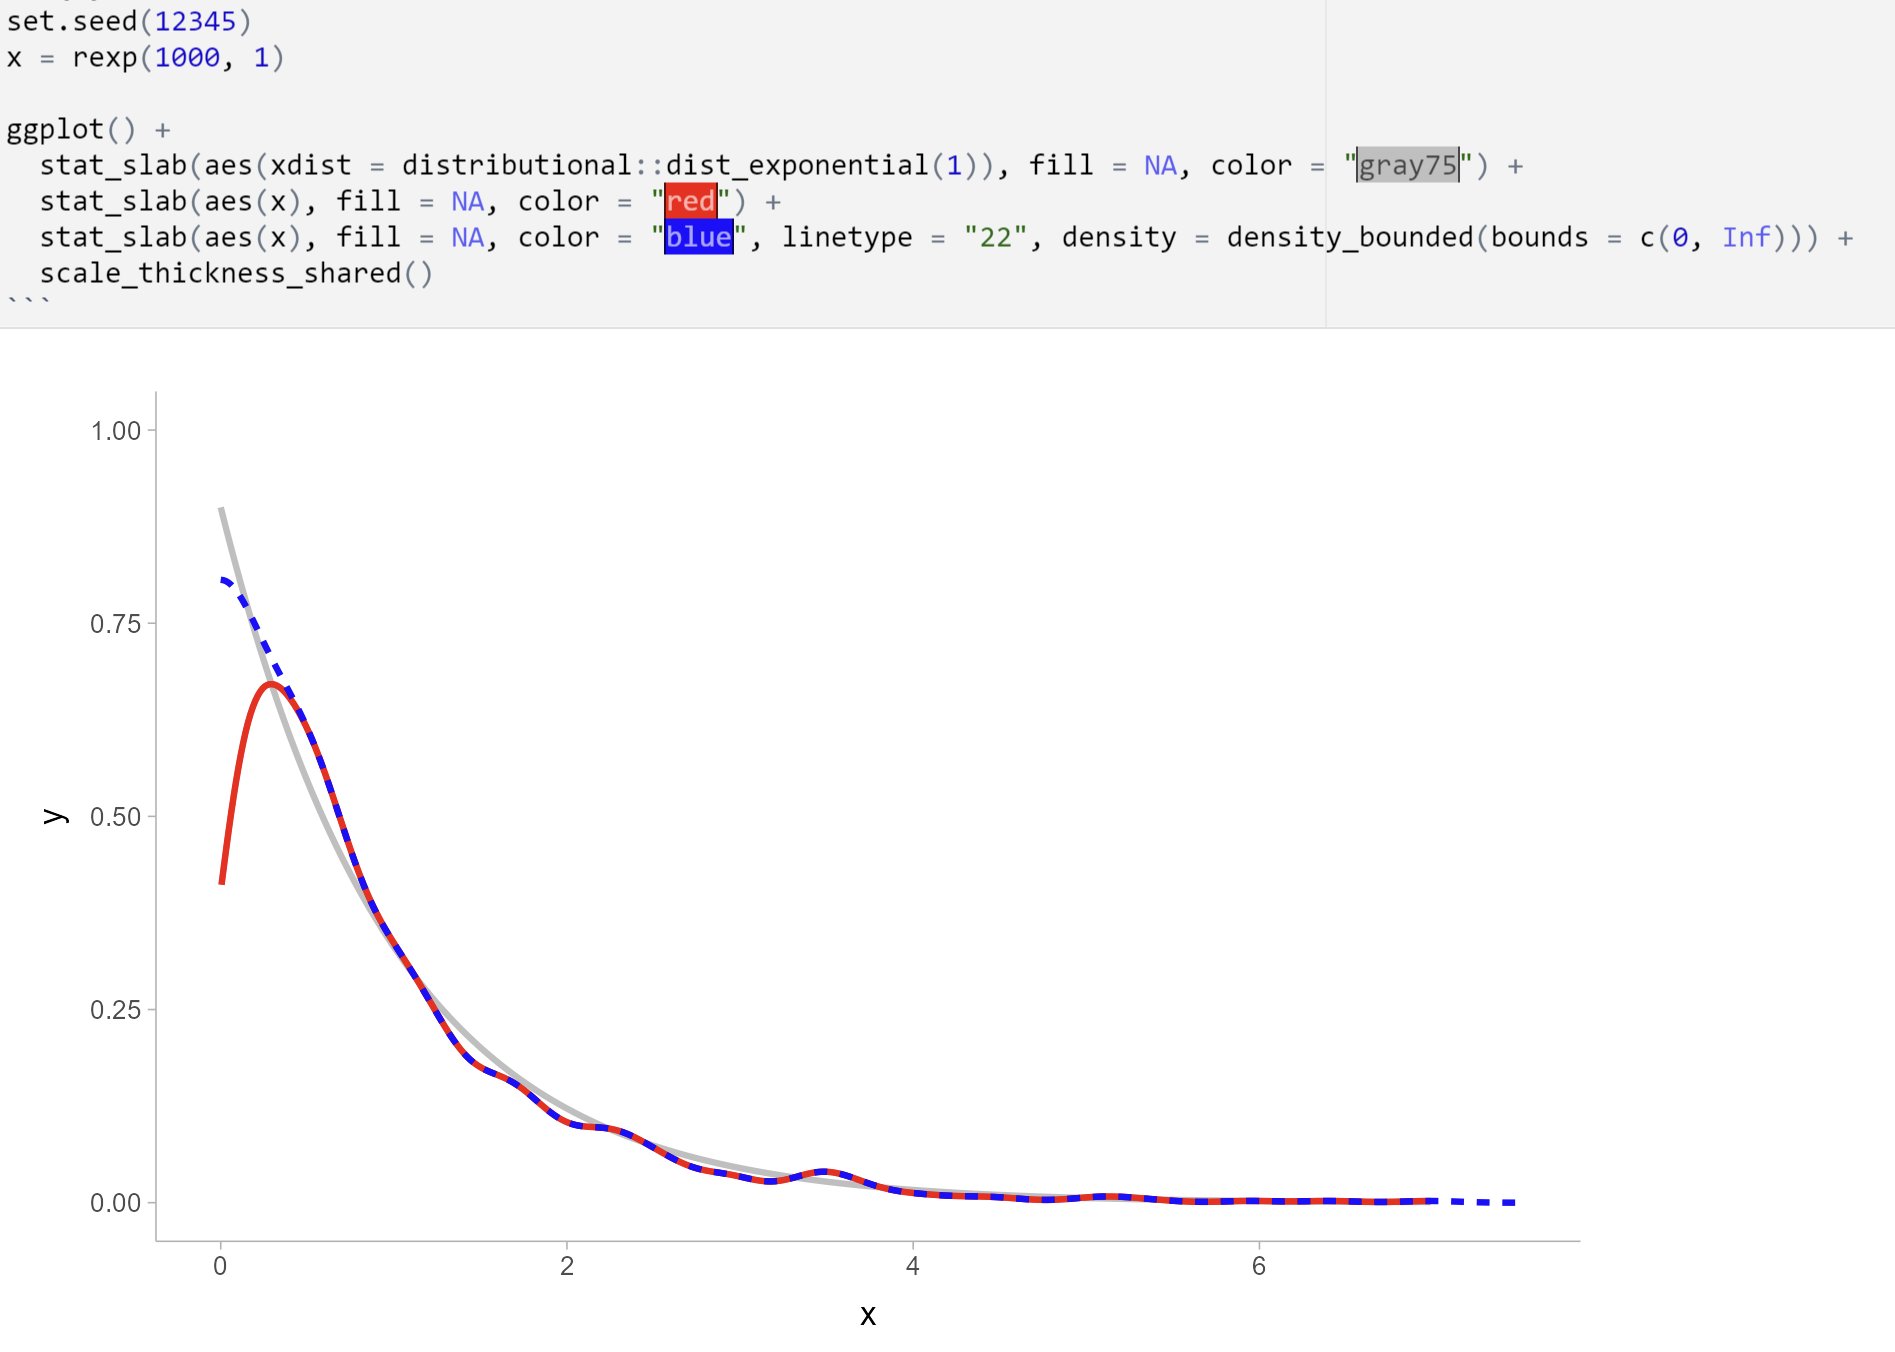
- {ggdist} 3.2.1: Visualizations of Distributions and Uncertainty - diffify

- {extrafont} 0.19: Tools for Using Fonts - diffify
- {formatR} 1.14: Format R Code Automatically - diffify
- {DT} 0.27: A Wrapper of the JavaScript Library ‘DataTables’ - diffify
- {bookdown} 0.32: Authoring Books and Technical Documents with R Markdown - diffify
- {tuneR} 1.4.2: Analysis of Music and Speech - diffify
- {pryr} 0.1.6: Tools for Computing on the Language - diffify
- {rstan} 2.21.8: R Interface to Stan - diffify
- {terra} 1.6-53: Spatial Data Analysis - diffify
- {RCMinification} 1.2: Random Coefficient Minification Time Series Models - diffify
- {rayimage} 0.9.1: Image Processing for Simulated Cameras - diffify
- {dbplyr} 2.3.0: A ‘dplyr’ Back End for Databases - diffify
- {raster} 3.6-14: Geographic Data Analysis and Modeling - diffify
- {ngramr} 1.9.3: Retrieve and Plot Google n-Gram Data - diffify
- {Rcpp} 1.0.10: Seamless R and C++ Integration - diffify
- {BH} 1.81.0-1: Boost C++ Header Files - diffify
- {parallelly} 1.34.0: Enhancing the ‘parallel’ Package - diffify
- {vroom} 1.6.1: Read and Write Rectangular Text Data Quickly - diffify
- {pins} 1.1.0: Pin, Discover and Share Resources - diffify
Videos and Podcasts
Shiny Apps
R Internationally
Tutorials
-
To downsample imbalanced data or not, with #TidyTuesday bird feeders
-
A GAM for time trends in a stepped-wedge trial with a binary outcome
R Project Updates
Updates from R Core:
Upcoming Events in 3 Months
Events in 3 Months:
Quotes of the Week
Why do functions used within walk/map functions from purrr not use open and closed parentheses? #rstats
— David Keyes (@dgkeyes) January 20, 2023
Why this?
reports %>%
pwalk(rmarkdown::render)
And not this?
reports %>%
pwalk(rmarkdown::render())
R has become one of the most popular programming language in data journalism. My guess: largely thanks to @Rstudio and the #tidyverse ecosystem #rstats #ddj #datajournlism #datascience https://t.co/KBDuk1Yjn3
— 𝙳𝚞𝚌-𝚀𝚞𝚊𝚗𝚐 𝙽𝚐𝚞𝚢𝚎𝚗 (@duc_qn) January 19, 2023
I'm thinking about moving from RStudio to VSCode.#rstats folks: What are good resources to make the transition as smooth as possible? Any obstacles I should be aware of?
— Albert Rapp (@rappa753) January 14, 2023