Live
-
{{ is_pkg(link.U) }}{{ link.T }} {{ get_host(link.U) }} - {{ link.N }} ( {{ get_host(link.U) }} )
{{ is_pkg(link.U) }}{{ link.T }} {{ get_host(link.U) }}( {{ get_host(link.U) }} )
{{ item.date }}
-
{{ is_pkg(link.U) }}{{ link.T }} {{ get_host(link.U) }} - {{ link.N }}
( {{ get_host(link.U) }} ){{ is_pkg(link.U) }}{{ link.T }} {{ get_host(link.U) }}
( {{ get_host(link.U) }} )
R Weekly 2022-W37 Mapping wind, Expected points, LEGO model with Docker
This week’s release was curated by Jon Calder, with help from the R Weekly team members and contributors.
Highlight
Insights
R in the Real World
-
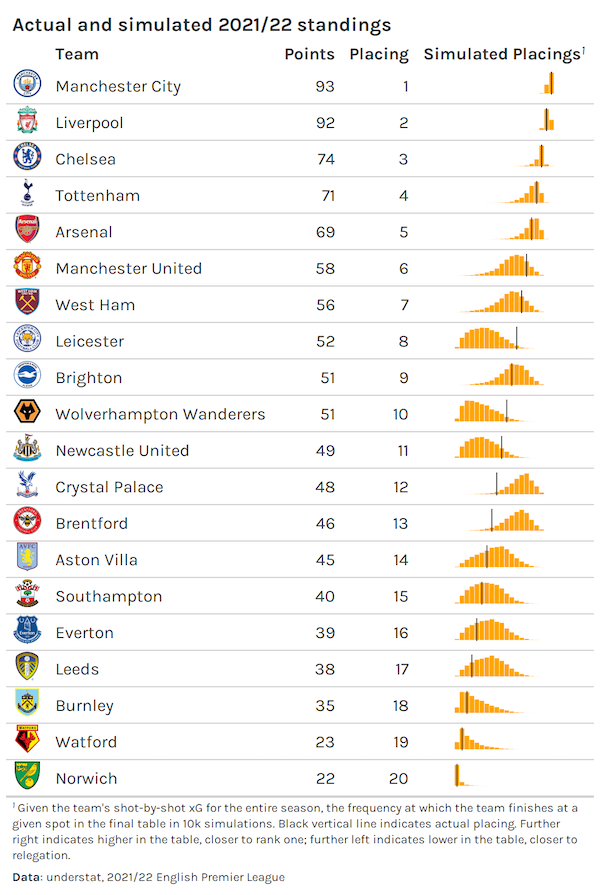
Calculating and comparing expected points from different expected goals sources (soccer)
-
Evaluating how we can use match outcome probabilites for season-long insights (soccer)

-
RObservations #38: Visualizing Average Delay Times On TTC Subway Stations
-
How strongly does German electricity demand react to high prices?
R in Academia

New Packages
CRAN
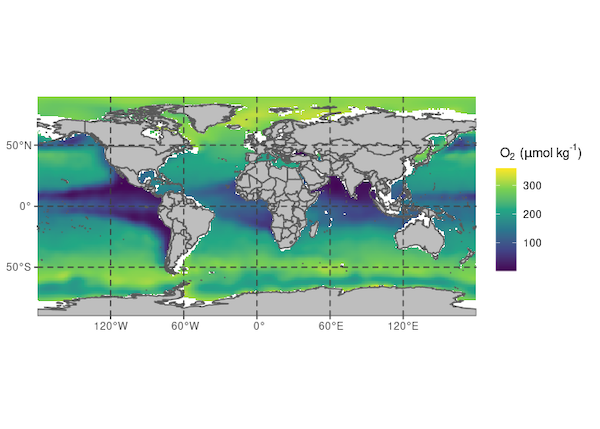
- {oceanexplorer} 0.0.1: Explore Our Planet’s Oceans with NOAA

-
{wordbankr} 1.0.0: Accessing the Wordbank Database
-
{luz} 0.3.1: Higher Level ‘API’ for torch
-
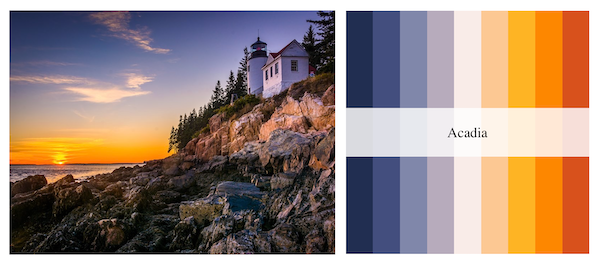
{NatParksPalettes} 0.1.4: Color Palettes Inspired by National Parks

GitHub
- {cropcircles} 0.1.0: Crop an Image into a Circle with a Transparent Background
Updated Packages
-
{telegram.bot} 3.0.0: Develop a ‘Telegram Bot’ with R - diffify
-
{officer} 0.4.4: Manipulation of Microsoft Word and PowerPoint Documents - diffify
-
{libr} 1.2.8: Libraries, Data Dictionaries, and a Data Step for R - diffify
-
{cli} 3.4.0: Helpers for Developing Command Line Interfaces - diffify
Videos and Podcasts
-
[TidyX Episode 115 R Classes and Objects - Making an S4 Object, Part 2 - S4 Tournament](https://www.youtube.com/watch?v=ktlJJHlR0Ck)
R Internationally
Tutorials
R Project Updates
Updates from R Core:
Upcoming Events in 3 Months
Events in 3 Months:
-
September 13: Fundamentals of Exploratory and Inferential Spatial Data Analysis in R workshop
-
September 14: ‘Advanced Shiny Development’ the hands-on workshop
-
September 21: R-Ladies NYC Lightning Talks - RSVP and Call for Speakers
-
October 6-7: Shiny in Production conference from Jumping Rivers
Grants & Funding
- R Consortium ISC Call for Proposals - Infrastructure Steering Committee (ISC) grants for low-to-medium risk projects with a focused scope and likely to have a broad impact on the R Community. Deadline 2022-10-01.
Datasets
-
{m5} 0.1.1: ‘M5 Forecasting’ Challenges Data
-
{allhomes} 0.3.0: Extract Past Sales Data from Allhomes.com.au
-
{BFS} 0.4.3: Get Data from the Swiss Statistical Office
-
{resampledata3} 1.0: Data Sets for “Mathematical Statistics with Resampling and R” (3rd Ed)
Jobs
💼 Explore Jobs & Gigs Board on RStudio Community 💼
rtistry
Shortly after I made a plot in June, I wrote a little Shiny app to experiment with different settings. And then added a theme and some buttons. Here it is, if you want to play with it:https://t.co/YP5Yq9SDsq#RStats #rtistry https://t.co/ZBUjKGWbje pic.twitter.com/b6AWRrl4BN
— Georgios Karamanis (@geokaramanis) September 9, 2022
Quotes of the Week
I've just discovered you can join, split, and compress PDF files with {pdftools} in #rstats, and extracted a specific chapter from a >3000 pages long PDF in two lines of code.
— Silvia Gutiérrez (@espejolento) September 5, 2022
I love you @rOpenSci
💻🤖💜
Code: https://t.co/xWP4JLXJHa pic.twitter.com/KvHdVtQVIo
I am teaching grad #DataVisualization this fall, so I want to know what you find HARD with data viz, both in general and specifically within #rstats & #tidyverse
— Dr. Emorie Beck (@EmorieBeck) September 6, 2022
Plz RT! I hope to make all these materials #openscience and will eventually couple it with a data management course!
My new favorite R package for uncovering distributions.
— Matt Dancho (Business Science) (@mdancho84) September 9, 2022
And I made a free tutorial to help you get up to speed. #rstats https://t.co/DdyySc3ksh pic.twitter.com/9ao7ZuAt8m