Live
-
{{ is_pkg(link.U) }}{{ link.T }} {{ get_host(link.U) }} - {{ link.N }} ( {{ get_host(link.U) }} )
{{ is_pkg(link.U) }}{{ link.T }} {{ get_host(link.U) }}( {{ get_host(link.U) }} )
{{ item.date }}
-
{{ is_pkg(link.U) }}{{ link.T }} {{ get_host(link.U) }} - {{ link.N }}
( {{ get_host(link.U) }} ){{ is_pkg(link.U) }}{{ link.T }} {{ get_host(link.U) }}
( {{ get_host(link.U) }} )
R Weekly 2022-W28 Containers, Conf, Clicks
RSS feeds are once again being captured. Want your posts automatically submitted to the editors each week? Add your feed to our list.
This week’s release was curated by Jonathan Carroll, with help from the R Weekly team members and contributors.
Highlight

Insights
-
Introducing {weatherkit}: The Eventual Replacement R Package for {darksky}
-
Reshaping data frames using pivot functions from {tidyr} and tally from {dplyr}

-
Slight inconsistency between forcats’ fct_lump_min and fct_lump_prop
-
How to install R 3.6.3 (NOT 4+) on Linux MINT 19.x (19.1, 19.2, 19.3)
-
Recreating the Shiny App tutorial with a Plumber API + React: Part 1

R in the Real World
-
R Ladies Cuernavaca Partners with Biotechnology Institute to Quickly Expand Reach in 2022
-
R Lille Group Organizer, Mickaël Canouil, Talks About Guiding New Users
Resources
- useR! 2022: R’s C interface: Perspectives from Wrapping a C Library (session presentation slides)
New Packages
CRAN
- {nestedcv} 0.2.3: Nested Cross-Validation with ‘glmnet’ and ‘caret’
- {delaunay} 1.0.0: 2d, 2.5d, and 3d Delaunay Tessellations
- {rtiddlywiki} 0.1.0: R Interface for ‘TiddlyWiki’
- {dtrackr} 0.2.4: Track your Data Pipelines
- {ggseqplot} 0.6.2: Render Sequence Plots using ‘ggplot2’
- {archetypal} 1.3.0: Finds the Archetypal Analysis of a Data Frame
- {qPCRtools} 0.1.1: Tools for qPCR
- {ixplorer} 0.2.2: Easy DataOps for R Users
- {RcppColors} 0.1.0: ‘C++’ Header Files for Color Conversion and Color Mappings
- {scAnnotate} 0.0.1: An Automated Cell Type Annotation Tool for Single-Cell RNA-Sequencing Data
- {sciRmdTheme} 0.1: Upgraded ‘Rmarkdown’ Themes for Scientific Writing
- {farr} 0.2.27: Data and Code for Financial Accounting Research
- {bandit} 0.5.1: Functions for Simple a/B Split Test and Multi-Armed Bandit Analysis
GitHub or Bitbucket
-
{huggingfaceR} 0.1.0: Hugging Face state-of-the-art models in R.
-
{s3fs} 0.1.0: File System like
APIfor Amazon Web ServiceS3. -
{ggcolormeter} 0.1.0: A ggplot2 color/fill legend guide extension in the style of a dashboard meter.
Updated Packages
- {nanonext} 0.5.2: NNG (Nanomsg Next Gen) Lightweight Messaging Library - diffify
- {ggseqplot} 0.6.2.9000: R library for visualizing (social science) sequence data using ggplot2 - diffify
- {metrica} 2.0.0: Prediction Performance Metrics - diffify
- {rgl} 0.109.6: 3D Visualization Using OpenGL - diffify
- {Rcpp} 1.0.9: Seamless R and C++ Integration - diffify
- {robust} 0.7-1: Port of the S+ “Robust Library” - diffify
- {ggspatial} 1.1.6: Spatial Data Framework for ggplot2 - diffify
- {drda} 2.0.1: Dose-Response Data Analysis - diffify
- {ActivePathways} 1.1.1: Integrative Pathway Enrichment Analysis of Multivariate Omics Data - diffify
- {vmr} 0.0.4: Virtual Machines for R - diffify
- {devtoolbox} 0.2.0: Tools for the R Developer - diffify
- {broman} 0.80: Karl Broman’s R Code - diffify
- {wdpar} 1.3.3: Interface to the World Database on Protected Areas - diffify
- {cna} 3.4.0: Causal Modeling with Coincidence Analysis - diffify
- {usincometaxes} 0.5.0: Calculate Federal and State Income Taxes in the United States - diffify
- {lme4} 1.1-30: Linear Mixed-Effects Models using ‘Eigen’ and S4 - diffify
- {IDSL.MXP} 1.5: Parser for mzML, mzXML, and netCDF Files (Mass Spectrometry Data) - diffify
- {IDSL.IPA} 1.9: Intrinsic Peak Analysis (IPA) for HRMS Data - diffify
- {htmlTable} 2.4.1: Advanced Tables for Markdown/HTML - diffify
- {tune} 1.0.0: Tidy Tuning Tools - diffify
- {nflverse} 1.0.2: Easily Install and Load the ‘nflverse’ - diffify
- {processx} 3.7.0: Execute and Control System Processes - diffify
- {vetr} 0.2.14: Trust, but Verify - diffify
- {cgmanalysis} 2.7.3: Clean and Analyze Continuous Glucose Monitor Data - diffify
- {nflseedR} 1.1.0: Functions to Efficiently Simulate and Evaluate NFL Seasons - diffify
- {shorts} 2.0.0: Short Sprints - diffify
- {webdeveloper} 1.0.1: Functions for Web Development - diffify
- {wrMisc} 1.9.2: Analyze Experimental High-Throughput (Omics) Data - diffify
- {jsTreeR} 2.1.0: A Wrapper of the JavaScript Library ‘jsTree’ - diffify
- {quarto} 1.2: R Interface to ‘Quarto’ Markdown Publishing System - diffify
- {stacks} 1.0.0: Tidy Model Stacking - diffify
- {dockerfiler} 0.2.0: Easy Dockerfile Creation from R - diffify
- {farver} 2.1.1: High Performance Colour Space Manipulation - diffify
- {ctrdata} 1.10.0: Retrieve and Analyze Clinical Trials in Public Registers - diffify
- {oce} 1.7-8: Analysis of Oceanographic Data - diffify
- {broom.helpers} 1.8.0: Helpers for Model Coefficients Tibbles - diffify
- {fastmatrix} 0.4-12: Fast Computation of some Matrices Useful in Statistics - diffify
- {jds.rmd} 0.3.1: R Markdown Templates for Journal of Data Science - diffify
- {tcgaViz} 1.0.1: Visualization Tool for the Cancer Genome Atlas Program (TCGA) - diffify
- {ChaosGame} 1.3: Chaos Game - diffify
- {insight} 0.18.0: Easy Access to Model Information for Various Model Objects - diffify
- {Cairo} 1.6-0: R Graphics Device using Cairo Graphics Library for Creating High-Quality Bitmap (PNG, JPEG, TIFF), Vector (PDF, SVG, PostScript) and Display (X11 and Win32) Output - diffify
- {RSDA} 3.0.12: R to Symbolic Data Analysis - diffify
- {dendextend} 1.16.0: Extending ‘dendrogram’ Functionality in R - diffify
- {csv} 0.6.2: Read and Write CSV Files with Selected Conventions - diffify
- {latticeExtra} 0.6-30: Extra Graphical Utilities Based on Lattice - diffify
- {tinyscholar} 0.1.6: Get and Show Personal ‘Google Scholar’ Profile - diffify
- {rpanel} 1.1-5.1: Simple Interactive Controls for R using the ‘tcltk’ Package - diffify
- {gam} 1.20.2: Generalized Additive Models - diffify
- {bizicount} 1.1.0: Bivariate Zero-Inflated Count Models Using Copulas - diffify
Videos and Podcasts
-
How to style your Quarto blog without knowing a lot of HTML/CSS
-
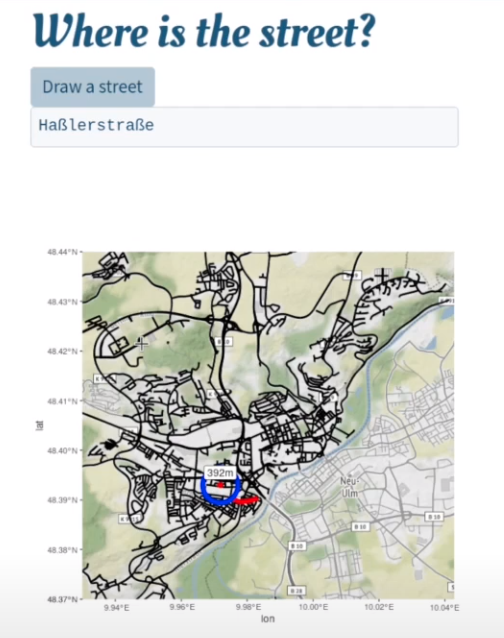
How to build an interactive point-and-click game with {Shiny}
Gist & Cookbook
Tutorials
R Project Updates
Updates from R Core:
Upcoming Events in 3 Months
Events in 3 Months:
Call for Participation
Quotes of the Week
👯 I keep opening the same #RStudio Project twice because I am foolish. So I wrote an #RStats function to tell me when I'm being foolish.
— Matt Dray (@mattdray) July 8, 2022
📝 Post: https://t.co/P9dGZAQQwl
🐙 Gist: https://t.co/nwfQ5KyQTH pic.twitter.com/HCYZrjajvm
#RStats tip that I got from @gavinprm and now use daily. If you want to close all your @rstudio source files, except the one you're on, use Ctrl + Alt +Shift +W. No more closing every single script and view to clean things up.
— Oscar Baruffa (@OscarBaruffa) July 4, 2022
— Romain François (@romain_francois) July 6, 2022