Live
-
{{ is_pkg(link.U) }}{{ link.T }} {{ get_host(link.U) }} - {{ link.N }} ( {{ get_host(link.U) }} )
{{ is_pkg(link.U) }}{{ link.T }} {{ get_host(link.U) }}( {{ get_host(link.U) }} )
{{ item.date }}
-
{{ is_pkg(link.U) }}{{ link.T }} {{ get_host(link.U) }} - {{ link.N }}
( {{ get_host(link.U) }} ){{ is_pkg(link.U) }}{{ link.T }} {{ get_host(link.U) }}
( {{ get_host(link.U) }} )
R Weekly 2022-W13
This week’s release was curated by Ryo and Batool, with help from the R Weekly team members and contributors.
Announcement
We are resuming RWeekly after three months of hiatus ![]() due to the problems, we are experiencing with our infrastructure. For that reason, we apologise as we can’t accept posts by RSS feed in the next few months. We can only get submission through PRs in our GitHub repository or using @rweekly_submit in Twitter.
due to the problems, we are experiencing with our infrastructure. For that reason, we apologise as we can’t accept posts by RSS feed in the next few months. We can only get submission through PRs in our GitHub repository or using @rweekly_submit in Twitter.
If you have a problem submitting any content, please don’t hesitate to reach out directly to one of our team members. Thank you for being so patient!
Highlight
Insights
R in the Real World
R in Academia
Resources
-
Handbook of Regression Modeling in People Analytics by Keith McNulty.
-
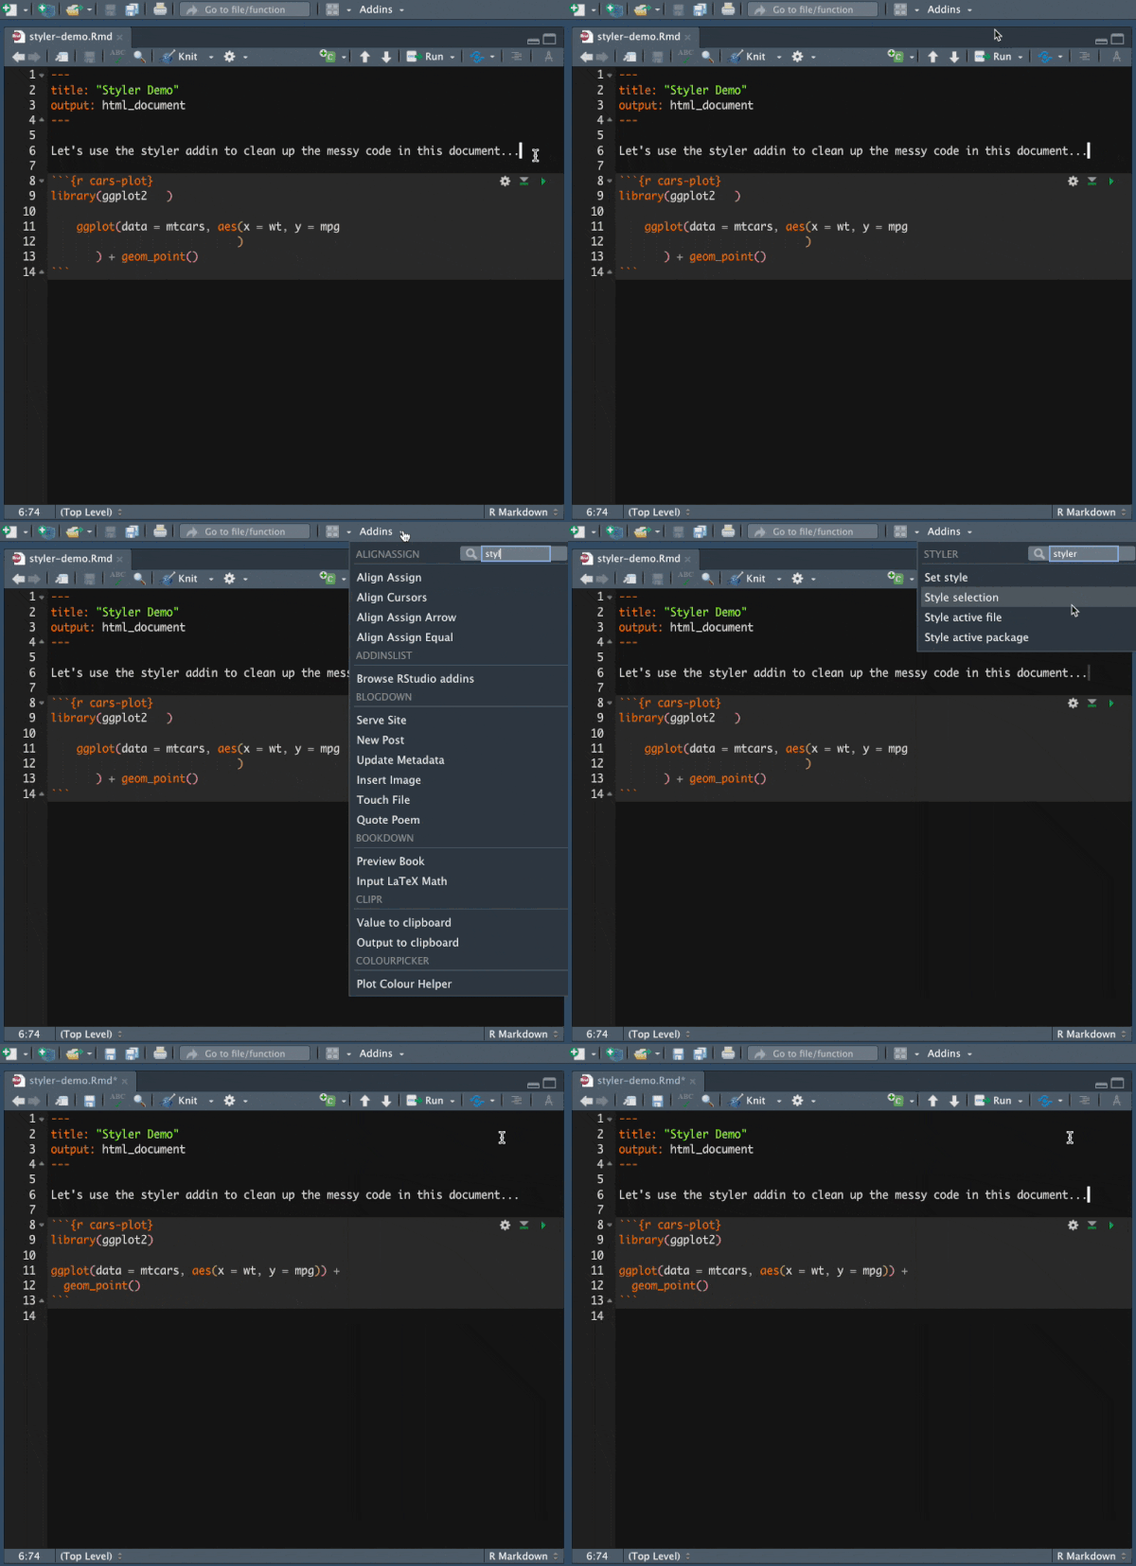
R Markdown Lesser-Known Tips & Tricks #2: Cleaning Up Your Code
New Packages
CRAN
-
{nanonext} 0.1.0: R binding for NNG (Nanomsg Next Gen), a successor to ZeroMQ
-
rasterpic: Create Spatial Rasters from Plain Images.
-
{itscalledsoccer} 0.1.0: American Soccer Analysis API Client.
GitHub or Bitbucket
-
{unifir} 0.1.0: A Unifying API for Working with Unity in R
Updated Packages
CRAN
-
parallelly 1.30.0 - Enhancing the ‘parallel’ Package
-
progressr 0.10.0 - An Inclusive, Unifying API for Progress Updates
Videos and Podcasts
Shiny Apps
R Internationally
Tutorials
-
Report Ready PDF tables with rmarkdown, knitr, kableExtra, and LaTeX
-
A package of Machine Learning datasets has arrived for R – MLDataR
-
Introducing {wordle} - a package for helping solve Wordle puzzles

-
[Understanding the native R pipe >](https://ivelasq.rbind.io/blog/understanding-the-r-pipe/) -
Solving the ‘preserving the sum after rounding’ problem for a soccer waffle viz
-
{tvthemes 1.3.0} is on CRAN: ‘Steven Universe’-themed color palettes for ggplot2!
-
Pre-processing layers in keras: What they are and how to use them
- Managing bioinformatics pipelines with R
R Project Updates
Updates from R Core:
Update from the R Contribution Working Group (RCWG):
- The R Contribution Site has moved to https://contributor.r-project.org/.
- Our Twitter account is now active: https://twitter.com/R_Contributors.
- Our repos are now part of the R-Devel GitHub organization, bringing together community resources related to the development of R.
- We are planning a series of Collaboration Campfires for newcomers to learn more about contributing to R and to work collaboratively on activities.
Vist the RCWG repo to find the minutes for further details on these and other topics we discussed, and see the repo README for information on how to get involved. Our next meeting will be Friday, February 18, 2022, 15:00-16:00 UTC.
Upcoming Events in 3 Months
Events in 3 Months:
Call for Participation
Quotes of the Week
#Rstats: Copy data from Excel and paste it into R as a dataframe or tibble using datapasta:
— Dr. Guy Prochilo 🏳️🌈 (@GuyProchilo) March 22, 2022
install.packages("datapasta") -> set a useful keyboard paste shortcut#phdchat pic.twitter.com/jS7kwndF1q
How it feels every time my advisor tells an undergrad to come to me for help making figures in R because I'm the "best in the lab" #RStats pic.twitter.com/iOoYjFstN8
— Katie O'Reilly (@DrKatfish) March 21, 2022
Do you have a slide deck on writing functions the tidyverse style (ie passing arguments to dplyr functions that accept bare inputs and writing functions that accept bare inputs) you're willing to share? @jessicalavs and I are presenting on the topic soon 🕺#rstats #tidyverse
— Daniel Sjoberg (@statistishdan) January 4, 2022
