Live
-
{{ is_pkg(link.U) }}{{ link.T }} {{ get_host(link.U) }} - {{ link.N }} ( {{ get_host(link.U) }} )
{{ is_pkg(link.U) }}{{ link.T }} {{ get_host(link.U) }}( {{ get_host(link.U) }} )
{{ item.date }}
-
{{ is_pkg(link.U) }}{{ link.T }} {{ get_host(link.U) }} - {{ link.N }}
( {{ get_host(link.U) }} ){{ is_pkg(link.U) }}{{ link.T }} {{ get_host(link.U) }}
( {{ get_host(link.U) }} )
R Weekly 2021-W45 Coordinates from fictional maps, custom point shapes, moving branches
This week’s release was curated by Miles McBain, with help from the R Weekly team members and contributors.
Highlight
Insights
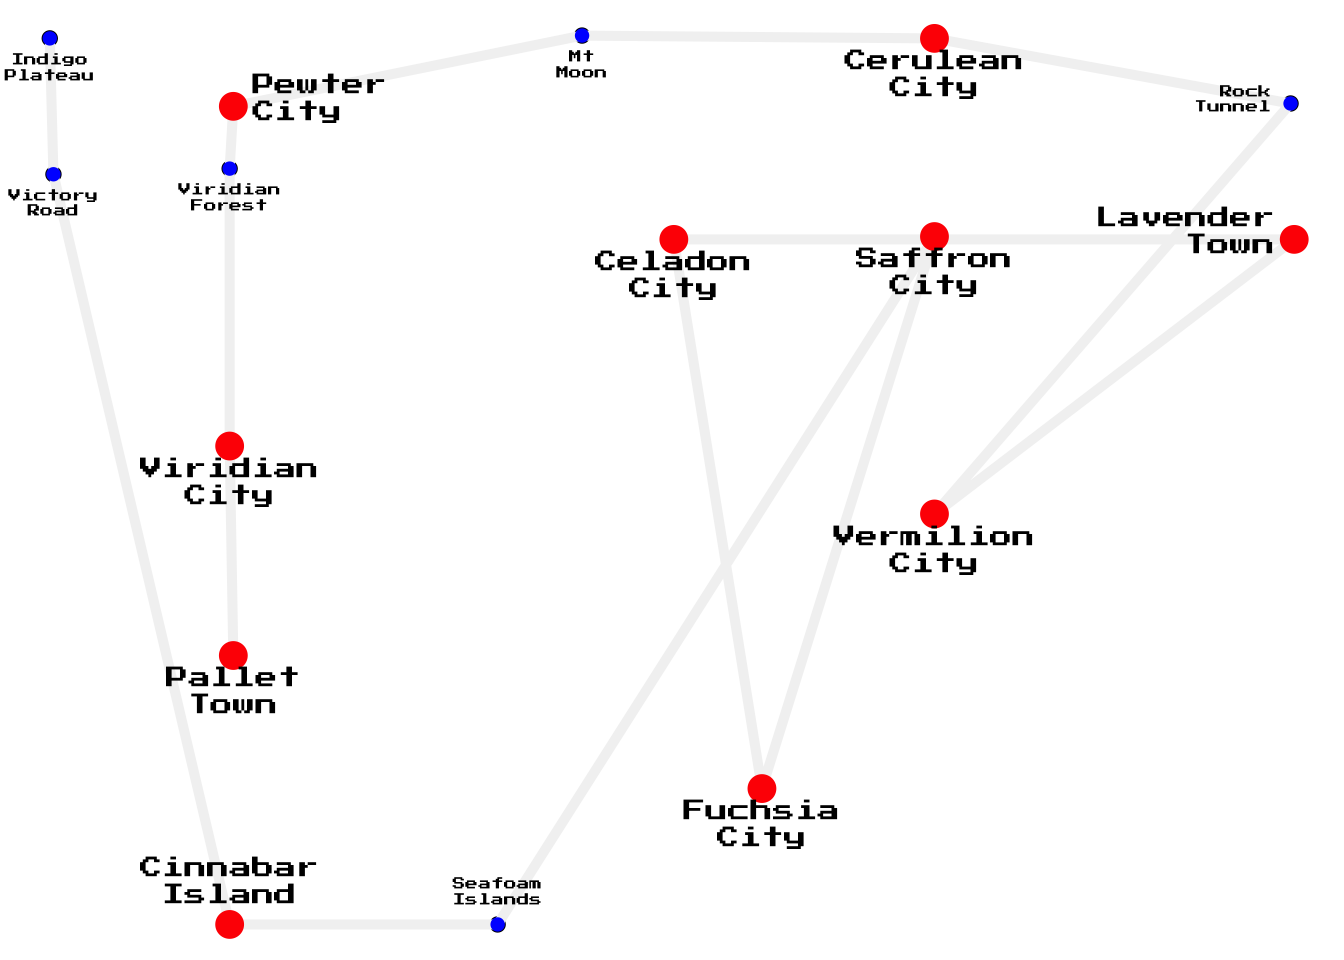
R in the Real World
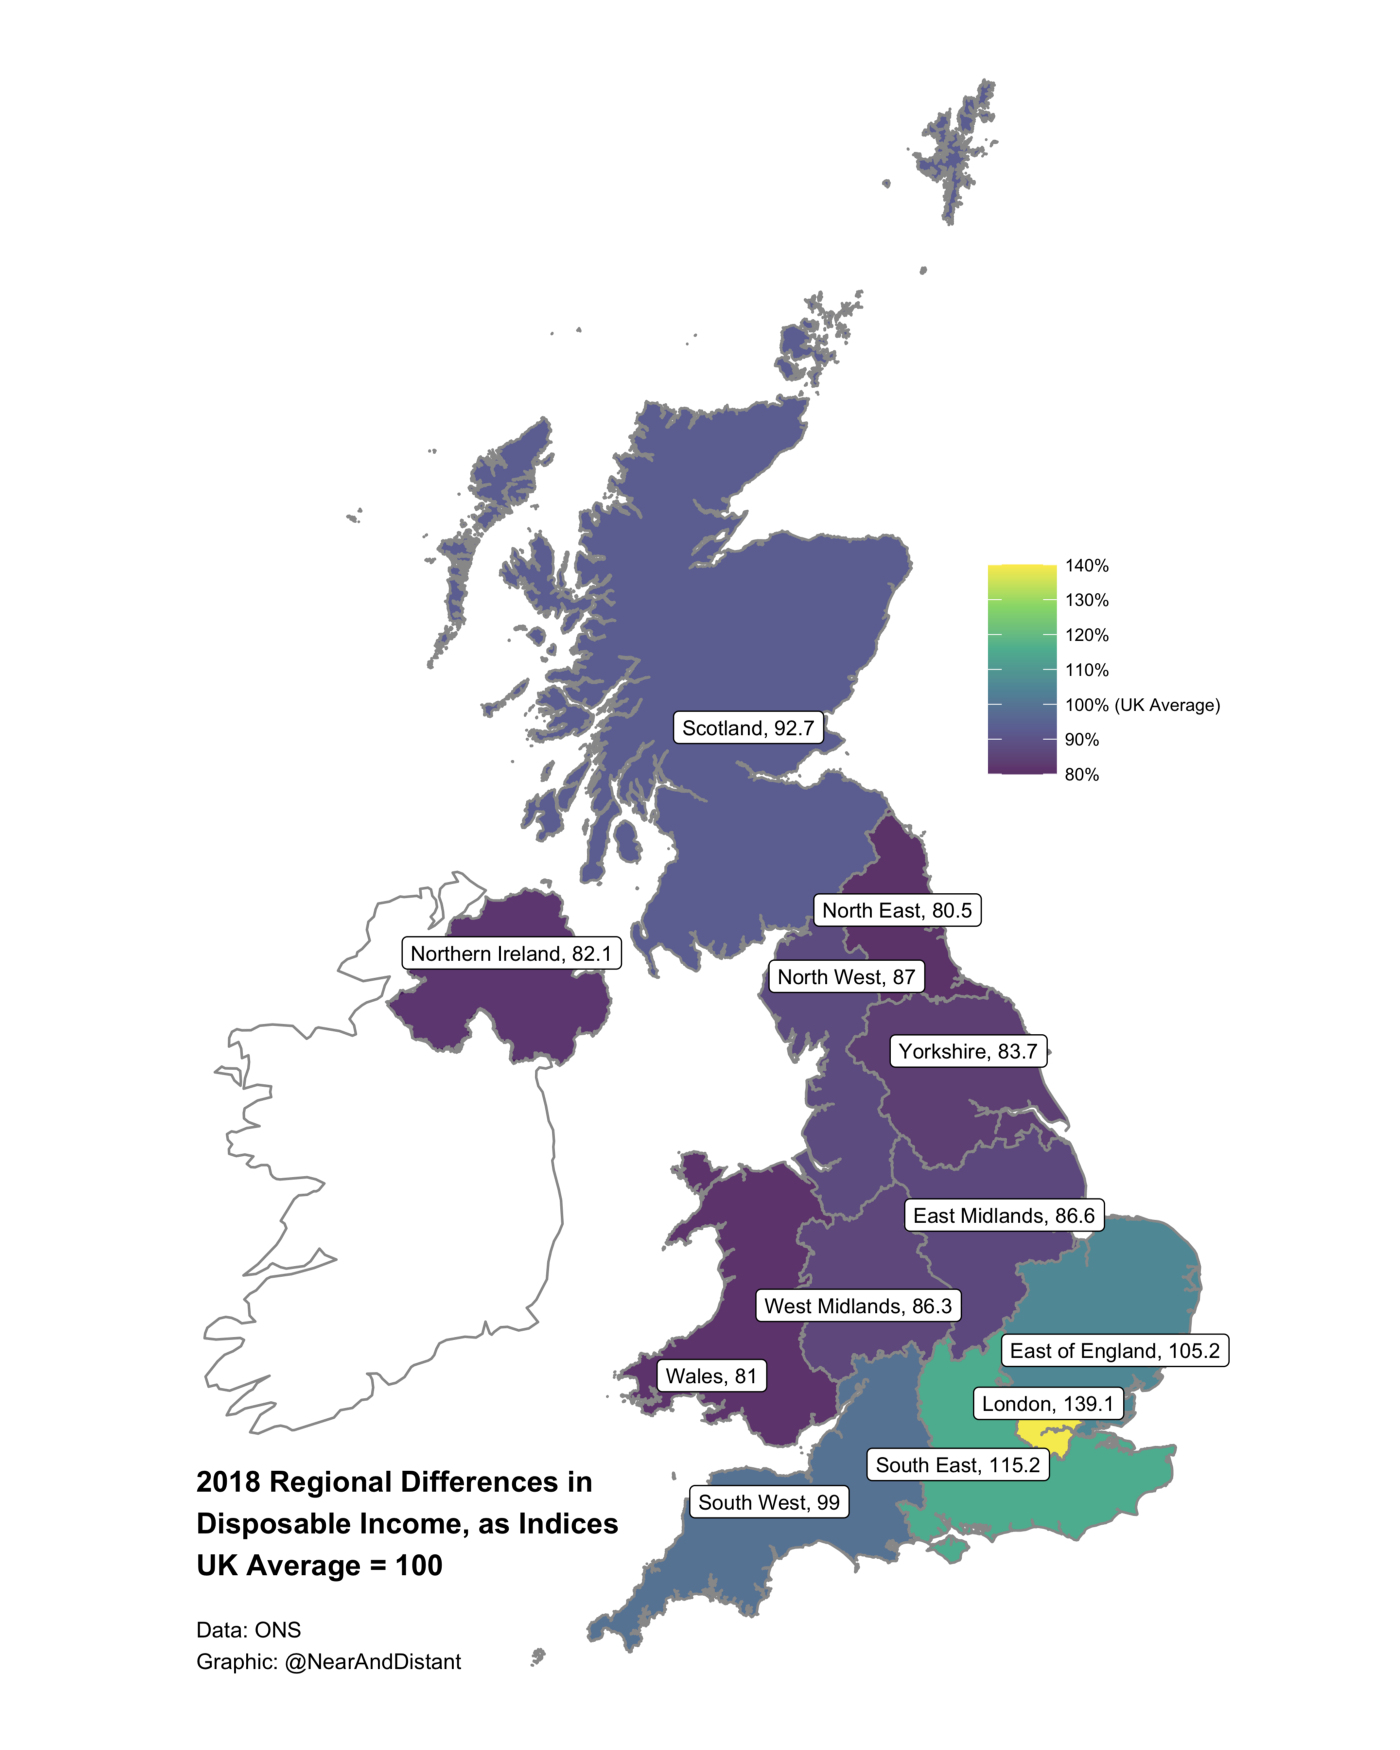
The Divided Kingdom: the UKs North-South divide is the most unequal in the developed world
Resources
Swirl-Tidy: A series of swirl lessons on how to use packages in {tidyverse}.
New Packages
CRAN
-
{mctq} 0.1.0 - Tools to process the Munich ChronoType Questionnaire (MCTQ)
-
{cffr} 0.1.0: Generate Citation File Format (cff) Metadata for R Packages
-
{makepipe} 0.0.4: Pipeline Tools Inspired by ‘GNU Make’
BioC
GitHub or Bitbucket
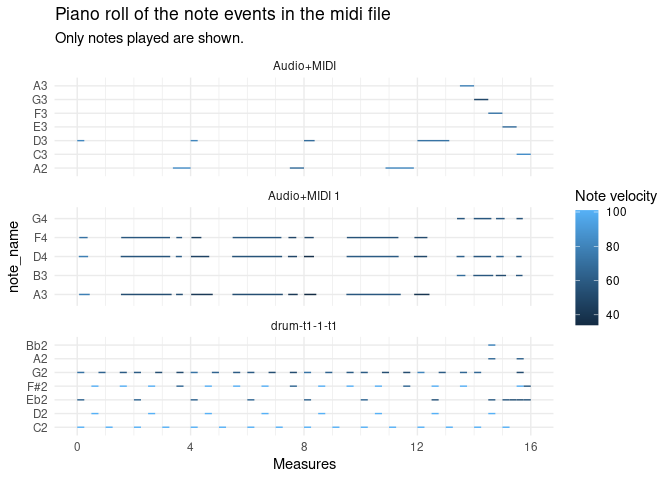
- pyramidi: Read & write midi data to / from data frames
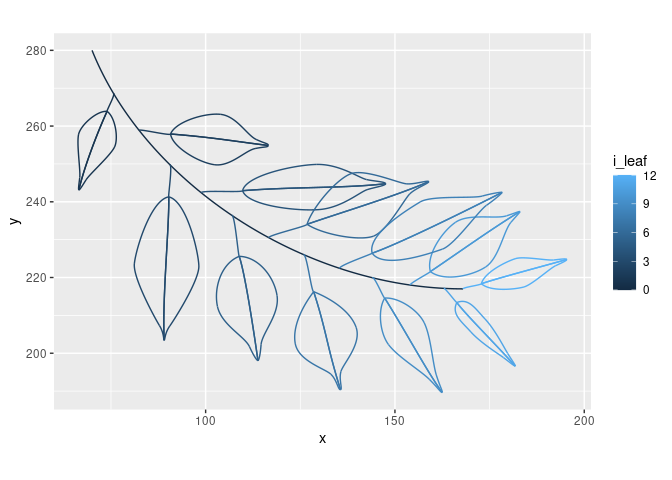
- ggbenjamini: Generate benjamini leaves with bezier curves
Updated Packages
-
{santoku} 0.6.0: A Versatile Cutting Tool
-
RcppQuantuccia 0.1.0 on CRAN: Full QuantLib Business Calendar Support
Videos and Podcasts
-
TidyX Episode 81 : Tidymodels - Logistic Regression with GLM
-
How to set up Automated Tests for Your R Package using testthat
Tutorials
R Project Updates
Updates from R Core:
Upcoming Events in 3 Months
Events in 3 Months:
-
November 13: R-Ladies Nairobi Anniversay Social
-
November 18th: NIMBLE tutorial
-
November 24th: Shiny Workshop
-
December 7th: Enhancing Software Peer Review with GitHub Automation
Call for Participation
Quotes of the Week
Thinking about it, Non Standard Evaluation is really a confusing name, what is "standard" ? + sometimes you use NSE in order NOT to evaluate your arguments. What it really is, AFAICT, is "argument capture", much less scary too IMO. #rstats
— Antoine Fabri (@antoine_fabri) November 1, 2021
📢🤓 Ever load a bunch of data frames in #rstats and want to look up which contain a particular variable name (or name snippet)? Check this out! #rdatarecipes 😎 https://t.co/owwgfJFISW pic.twitter.com/WnNfeyIS5Z
— Isabella Velásquez (@ivelasq3) November 5, 2021
remember kids everything in #rstats is a function pic.twitter.com/RifpqmKft7
— Matthew Kay (@mjskay) October 31, 2021