Live
-
{{ is_pkg(link.U) }}{{ link.T }} {{ get_host(link.U) }} - {{ link.N }} ( {{ get_host(link.U) }} )
{{ is_pkg(link.U) }}{{ link.T }} {{ get_host(link.U) }}( {{ get_host(link.U) }} )
{{ item.date }}
-
{{ is_pkg(link.U) }}{{ link.T }} {{ get_host(link.U) }} - {{ link.N }}
( {{ get_host(link.U) }} ){{ is_pkg(link.U) }}{{ link.T }} {{ get_host(link.U) }}
( {{ get_host(link.U) }} )
R Weekly 2025-W32 Migration to Quarto, carousels, Romeo & Juliet finances
This week’s release was curated by Eric Nantz, with help from the R Weekly team members and contributors.
Highlight
Insights
-
Julia Silge on Fostering a Technical, Inclusive R Community in Salt Lake City
-
openstatsware: From the mmrm R package to a lively community
R in the Real World
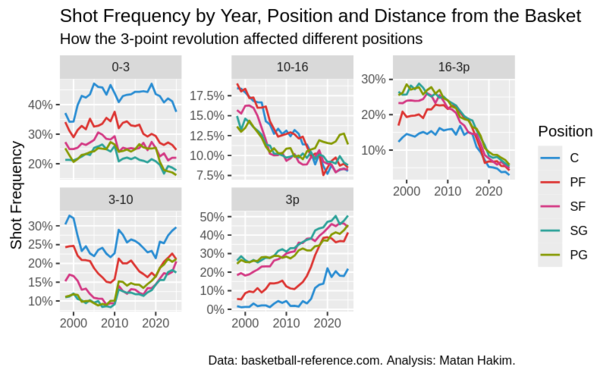
- Beyond the 3-Point Revolution: A Deep Dive into NBA Shot Selection by Position and Distance - How different positions have adapted to the changing landscape of NBA shooting

R in Organizations
Resources
New Packages
📦 Keep up to date wtih CRANberries 📦
CRAN
-
{simIC} 0.1.0: Simulate and Analyze Interval- and Mixed-Censored Survival Data
-
{ggdibbler} 0.1.0: Add Uncertainty to Data Visualisations

-
{staninside} 0.0.4: Facilitating the Use of ‘Stan’ Within Packages
-
{fortniteR} 0.1.0: Access ‘Fortnite Ecosystem’ API
-
{tidyrhrv} 1.1.0: Read, Iteratively Filter, and Analyze Multiple ECG Datasets
-
{ggplayfair} 0.1.1: Geoms for Playfair-Style Charts
-
{ggcorrheatmap} 0.1.2: Make Flexible ‘ggplot2’ Correlation Heatmaps

-
{REPS} 1.0.0: Hedonic and Multilateral Index Methods for Real Estate Price Statistics
-
{SlimR} 1.0.3: Marker-Based Package for Single-Cell and Spatial-Transcriptomic Annotation
-
{inteq} 1.0: Numerical Solution of Integral Equations
-
{socratadata} 0.1.0: Explore Socrata Data with Ease
-
{BayesianLasso} 0.3.5: Bayesian Lasso Regression and Tools for the Lasso Distribution
GitHub or Bitbucket
- crosswordio - Reading/writing crossword puzzles in PUZ format
Updated Packages
-
{imager} 1.0.5: Image Processing Library Based on ‘CImg’ - diffify
-
{likert} 1.3.5.1: Analysis and Visualization Likert Items - diffify
-
{rush} 0.3.0: Rapid Asynchronous and Distributed Computing - diffify
-
{badger} 0.2.5: Badge for R Package - diffify
-
{tidyposterior} 1.0.2: Bayesian Analysis to Compare Models using Resampling Statistics - diffify
-
{movementsync} 0.1.5: Analysis and Visualisation of Musical Audio and Video Movement Synchrony Data - diffify
-
{blackmarbler} 0.2.5: Black Marble Data and Statistics - diffify
-
{backbone} 2.1.5: Extracts the Backbone from Graphs - diffify
-
{bumbl} 1.0.4: Tools for Modeling Bumblebee Colony Growth and Decline - diffify
-
{tidyhte} 1.0.4: Tidy Estimation of Heterogeneous Treatment Effects - diffify
-
{tufte} 0.14.0: Tufte’s Styles for R Markdown Documents - diffify
-
{nhstplot} 1.4.0: Plot Null Hypothesis Significance Tests - diffify
-
{worldmet} 0.10.0: Import Surface Meteorological Data from NOAA Integrated Surface Database (ISD) - diffify
-
{runonce} 0.3.2: Run Once and Save Result - diffify
-
{WebAnalytics} 0.9.14: Web Server Log Analysis - diffify
Videos and Podcasts
Tutorials
-
How to Add a Total Row to a Data Frame in R: Complete Guide for R Programmers
-
Can Juliet manage without Romeo? How much she should spend, save, and invest to achieve that?

R Project Updates
Updates from R Core:
Call for Participation
Upcoming Events in 3 Months
Events in 3 Months:
Connect
Join the Data Science Learning Community