Live
-
{{ is_pkg(link.U) }}{{ link.T }} {{ get_host(link.U) }} - {{ link.N }} ( {{ get_host(link.U) }} )
{{ is_pkg(link.U) }}{{ link.T }} {{ get_host(link.U) }}( {{ get_host(link.U) }} )
{{ item.date }}
-
{{ is_pkg(link.U) }}{{ link.T }} {{ get_host(link.U) }} - {{ link.N }}
( {{ get_host(link.U) }} ){{ is_pkg(link.U) }}{{ link.T }} {{ get_host(link.U) }}
( {{ get_host(link.U) }} )
R Weekly 2020-31 shiny modules, exploring data, rstudio::global()
Release Date: 2020-08-03
This week’s release was curated by Jonathan Carroll, with help from the RWeekly team members and contributors.
Highlight
- A beginner’s guide to Shiny modules
- What if exploring data in R is just one line of code?
- rstudio::global() call for talks until August the 14th
Insights
- How I share knowledge around R Markdown
- Windows/UTF-8 Build of R and CRAN Packages
- Parallelized sampling using exponential variates
- {shinydisconnect}: Show a nice message when a Shiny app disconnects or errors

- Create a publication-ready correlation matrix, with significance levels, in R
- Network Analysis: Who is the Most Important Influencer?
- 3 Wild-Caught R and Python Applications
- Announcing Glosario
- The History of R (updated for 2020)
- June 2020: “Top 40” New CRAN Packages
- Get started with tidymodels and #TidyTuesday Palmer Penguins
- Release the penguins
- Raybonsai: Generate Procedural 3D Trees in R

- evaluating vector space models with word analogies
- Aligning the Dots On COVID Prison Waffles
- Building Complex SQL Queries with R
- Interrupted times series analysis of gabapentinoid prescriptions in England using piecewise regression.
- 12 R Markdown Tips, Tricks, and Shortcuts
- A beginner’s guide to Shiny modules
- Dark Mode and more improvements to CRAN as a userscript
- A dashboard of secured shiny apps.
- What if exploring data in R is just one line of code?

- {fabricerin}: Taking notes / drawing within RMarkdown documents and Shiny apps
- Can I host my R packages on npm? (Spoiler: yes)
R in Academia
Resources

New Packages
CRAN
- {assertive.reflection} 0.0-5: Assertions for Checking the State of R
- {bsub} 1.0.0: Submitter and Monitor of the ‘LSF Cluster’
- {faq} 0.1.0: Create FAQ Page
- {AEenrich} 1.0.0: Adverse Event Enrichment Tests
- {ascii} 2.3: Export R Objects to Several Markup Languages
- {runonce} 0.2.2: Run Once and Save Result
GitHub or Bitbucket
- {glossario}: A Multilingual Glossary
- {lz4lite}: extremely fast compression with LZ4
- {fabricerin}: Taking notes / drawing within RMarkdown documents and Shiny apps
- {ggkeyboard}: Make a keyboard using ggplot2
- {corrmorant}: R package for flexible correlation matrices based on ggplot2
- {highlighter}: A simple shiny app for highlighting text
Updated Packages
- {bubblyr} 0.1.2: Beautiful Bubbles in Shiny and RMarkdown Backgrounds
- {anytime} 0.3.8: Minor Maintenance
- {ttdo} 0.0.6: Bugfix
- {brms} 2.13.5: Bayesian Regression Models using ‘Stan’
- {tidyr} 1.1.1: Tidy Messy Data
- {dplyr} 1.0.1: A Grammar of Data Manipulation
- {crul} 1.0.0: HTTP Client
- {foghorn} 1.2.3: Summarize CRAN Check Results in the Terminal
- {bit64} 4.0.2: A S3 Class for Vectors of 64bit Integers
- {srvyr} 0.4.0: ‘dplyr’-Like Syntax for Summary Statistics of Survey Data
- {ckanr} 0.5.0: Client for the Comprehensive Knowledge Archive Network (‘CKAN’) API
- {gistr} 0.9.0: Work with ‘GitHub’ ‘Gists’
- {primes} 1.0.0: Generate and Test for Prime Numbers
- {shinycssloaders} 1.0.0: Add Loading Animations to a ‘shiny’ Output While It’s Recalculating
- {badger} 0.0.8: Badge for R Package
- {ttdo} 0.0.6: Extend ‘tinytest’ with ‘diffobj’
- {RBNZ} 1.1.0: Download Data from the Reserve Bank of New Zealand Website
- {journalabbr} 0.2.1: Journal Abbreviations for BibTeX Documents
- {listdown} 0.2.21: Create R Markdown from Lists
- {ropenaq} 0.2.10: Accesses Air Quality Data from the Open Data Platform OpenAQ
- {rstan} 2.21.2: R Interface to Stan
- {TMB} 1.7.18: Template Model Builder: A General Random Effect Tool Inspired by ‘ADMB’
- {highcharter} 0.8.2: A Wrapper for the ‘Highcharts’ Library
- {survminer} 0.4.8: Drawing Survival Curves using ‘ggplot2’
- {rvest} 0.3.6: Easily Harvest (Scrape) Web Pages
- {robotstxt} 0.7.8: A ‘robots.txt’ Parser and ‘Webbot’/’Spider’/’Crawler’ Permissions Checker
- {arrow} 1.0.0: Integration to ‘Apache’ ‘Arrow’
- {broomExtra} 4.0.4: Enhancements for ‘broom’ and ‘easystats’ Package Families
- {tsibble} 0.9.2: Tidy Temporal Data Frames and Tools
- {xfun} 0.16: Miscellaneous Functions by ‘Yihui Xie’
- {data.table} 1.13.0: Extension of
data.frame - {anytime} 0.3.8: Anything to ‘POSIXct’ or ‘Date’ Converter
Videos and Podcasts
R Internationally
Tutorials
- Data cleaning and exploration with data.table
- Can I host my R packages on npm? (Spoiler: yes)
- Journey through DB Connect installation hell
- 2020 La Liga Table
- State-of-the-art NLP models from R
- How to create PowerPoint reports with R
- Building A Neural Net from Scratch Using R - Part 2
- DBScan Clustering in R: Tutorial
- Testing interactive functions
R Project Updates
Updates from R Core:
Upcoming Events in 3 Months
Events in 3 Months:
- A list of R conferences and meetings
- This week’s local R-User and applied stats events
- Why R? 2020 (Remote 24-27 Sept) Conference
- Beyond Case Counts: Making COVID-19 Clinical Data Available and Useful. Thurs, August 13th, 9am PDT/12pm EDT/18:00 CEST
Datasets
- {fec16} 0.1.0: Data Package for the 2016 United States Federal Elections
- {GermaParl} 1.5.1: Download and Augment the Corpus of Plenary Protocols of the German Bundestag
- {covidregionaldata} 0.5.0: Subnational Data for the Covid-19 Outbreak
Call for Participation
- rstudio::global() call for talks until August the 14th
- Why R? 2020 (Remote 24-27 Sept) registration - 2020.whyr.pl
Quotes of the Week
Progress update: now plotting 1000 animated, alpha-blended circles, in a 1000x1000 window, with mouse interaction influencing rendering
— mikefc (@coolbutuseless) July 29, 2020
All being run from an event-loop in #RStats
Renders at ~60fps. Attached vid is a realtime screen capture. @oranwutan pic.twitter.com/EAVQ8hbXM0
Woo! found a great way to display uncertainties for all these estimates.
— Noam Ross (@noamross) July 28, 2020
Argh, they are all quite uncertain. pic.twitter.com/bdw57DGrub
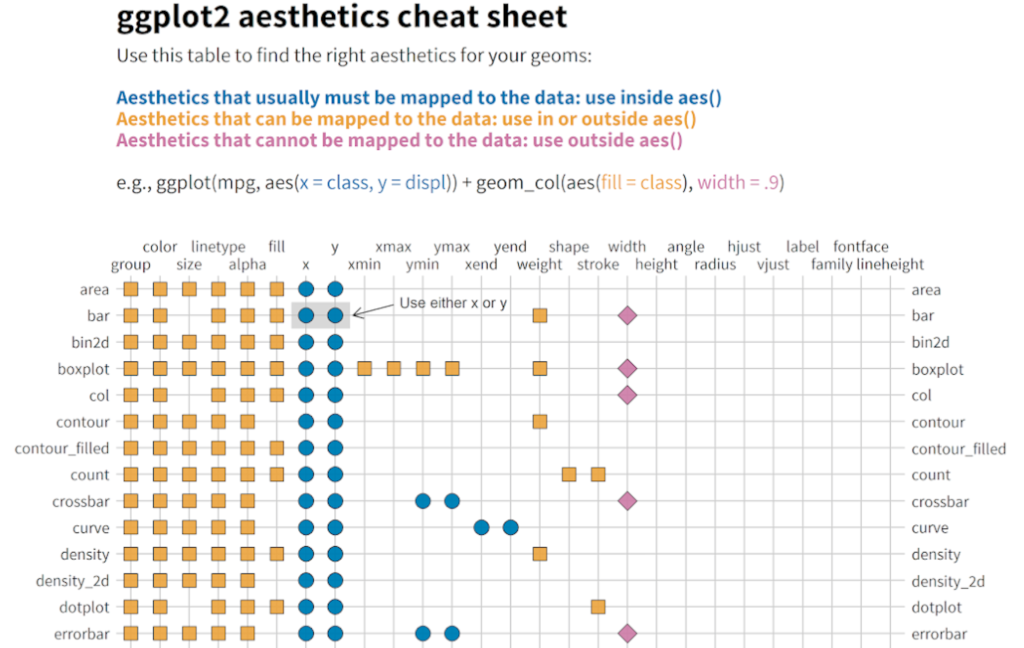
Feel free to use this #ggplot2 cheat sheet to quickly find the right aesthetics for your geoms.
— Christian Burkhart (@ChBurkhart) July 26, 2020
Feedback and improvements welcome #rstatshttps://t.co/WmuAC5i5rx pic.twitter.com/0e83VRpvYH