Live
-
{{ is_pkg(link.U) }}{{ link.T }} {{ get_host(link.U) }} - {{ link.N }} ( {{ get_host(link.U) }} )
{{ is_pkg(link.U) }}{{ link.T }} {{ get_host(link.U) }}( {{ get_host(link.U) }} )
{{ item.date }}
-
{{ is_pkg(link.U) }}{{ link.T }} {{ get_host(link.U) }} - {{ link.N }}
( {{ get_host(link.U) }} ){{ is_pkg(link.U) }}{{ link.T }} {{ get_host(link.U) }}
( {{ get_host(link.U) }} )
R Weekly 2018-48 ozunconf18
Highlight
-
ozunconf18 - R OpenSci ozunconference 2018 Projects
Insights
-
Checklist Recipe - How we created a template to standardize species data
-
Tis the Season to Check your SSL/TLS Cipher List Thrice (RCurl/curl/openssl)
R in the Real World
R in Organizations
Resources
-
ozunconf18 - R OpenSci ozunconference 2018 Projects
-
AI, Machine Learning and Data Science Roundup: November 2018
New Packages
CRAN
-
rsppfp - Implements different algorithms for transforming graphs in the Shortest Path Problem with Forbidden Paths
-
RFishBC - Back-Calculation of Fish Length
-
grrr - Package for changing default function arguments
-
citr - RStudio Addin to Insert Markdown Citations
GitHub or Bitbucket
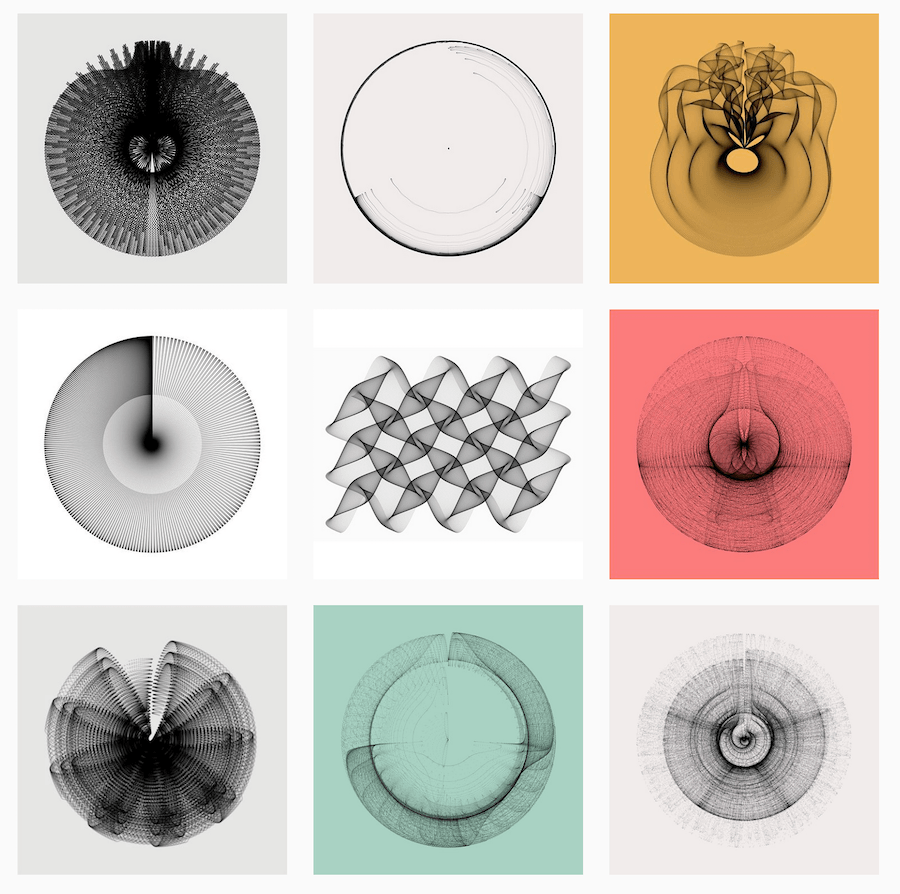
- generativeart - Generative Art
Package Releases
-
OpenCPU 2.1 - Scalable R Apps and Services
-
RcppMsgPack 0.2.3 - MsgPack Headers for R
Tutorials
Upcoming Events in 3 Months
Events in 3 Months:
More past events at R conferences & meetups.
Call for Participation
Quotes of the Week
⚡️ “R Animated GIFs” - curated collection of animated GIFs by various authors on #rstats topics.https://t.co/hWpwrJPF52
— Nic Crane (@nic_crane) November 23, 2018