Live
-
{{ is_pkg(link.U) }}{{ link.T }} {{ get_host(link.U) }} - {{ link.N }} ( {{ get_host(link.U) }} )
{{ is_pkg(link.U) }}{{ link.T }} {{ get_host(link.U) }}( {{ get_host(link.U) }} )
{{ item.date }}
-
{{ is_pkg(link.U) }}{{ link.T }} {{ get_host(link.U) }} - {{ link.N }}
( {{ get_host(link.U) }} ){{ is_pkg(link.U) }}{{ link.T }} {{ get_host(link.U) }}
( {{ get_host(link.U) }} )
R Weekly 2019-52 Joy in 2019
Highlight
-
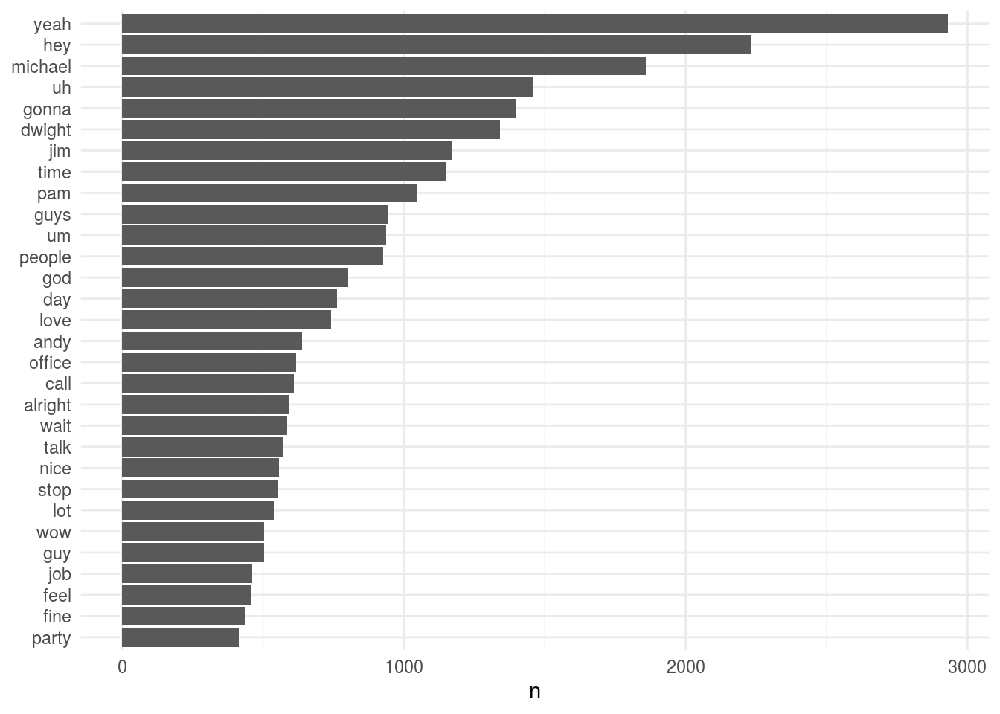
schrute - Introducing the schrute package the entire transcripts from The Office TV show
R in the Real World
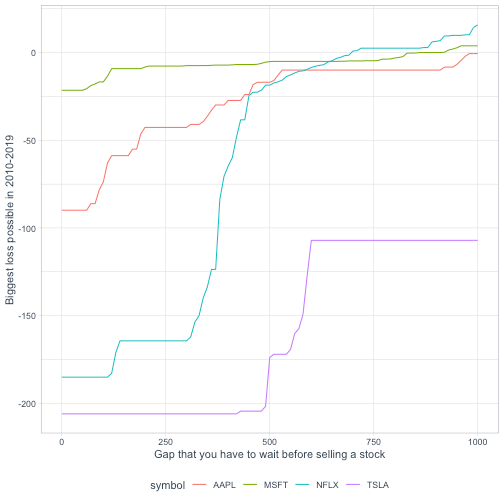
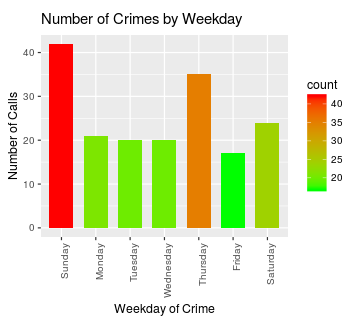
Insights
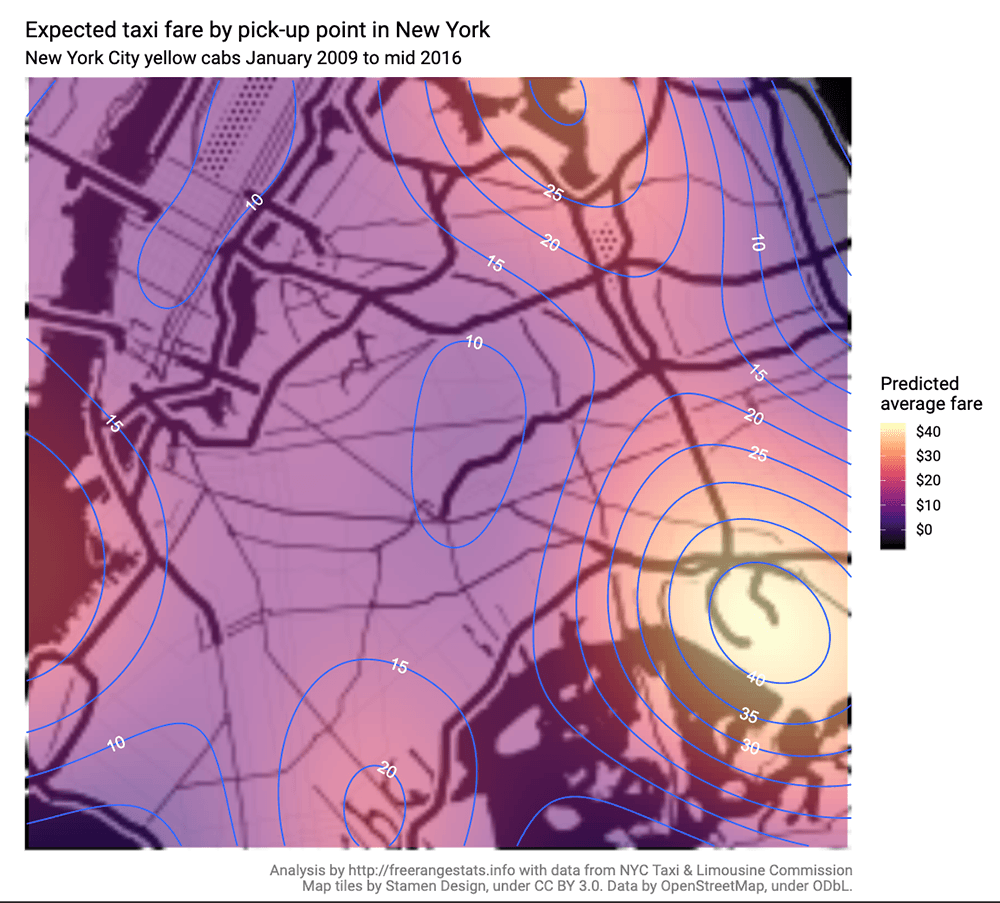
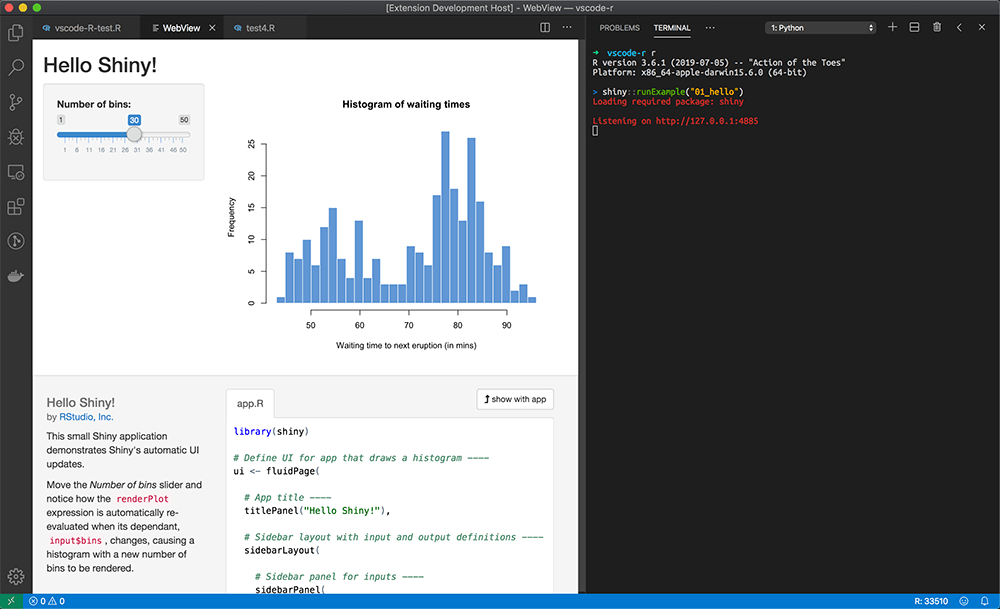
R in Organizations
Resources
-
hexmake - Build your own hex sticker
New Packages
CRAN
-
supreme - supreme is a modeling tool helping you better structure Shiny applications developed with modules
-
dockr - easy containerization for R
-
tfhub - R interface to TensorFlow Hub
-
schrute - Introducing the schrute package the entire transcripts from The Office TV show
Tutorials
-
How to use hierarchical cluster analysis on time series data
-
Vignette: Downloadable tables in RMarkdown with the DT package
-
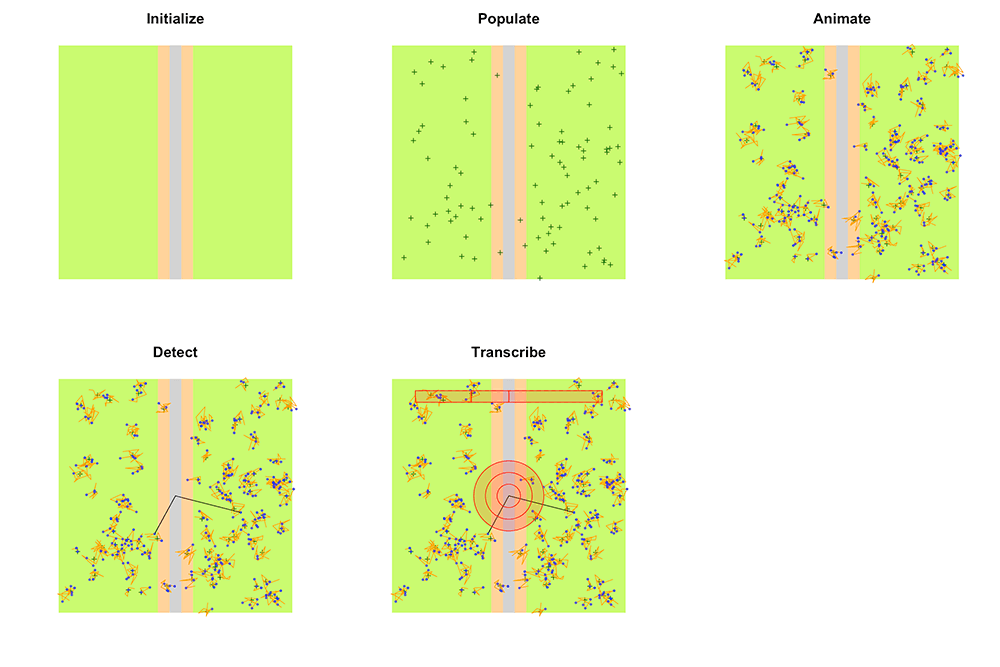
Introducing the bSims R package for simulating bird point counts
R Project Updates
Updates from R Core:
Upcoming Events in 3 Months
Events in 3 Months:
-
Thinking about rstudio::conf 2020? See the full conference schedule!
-
This week’s local R-User and applied stats eventsMore past events at R conferences & meetups.
Jobs
Call for Participation
Quotes of the Week
I love Mondays because that’s the day I get the R weekly newsletter.
From an R Weekly reader.
Just used the #rstats package `purrr` to read in 53 individual csv files and combine them all easy peasy. I've used this approach before, and it never ceases to make me smile. 5 years ago I would have combined them all by hand in Excel. My how far I've come. pic.twitter.com/JFR7fHVJwe
— Chris Prener (@chrisprener) December 20, 2019