Live
-
{{ is_pkg(link.U) }}{{ link.T }} {{ get_host(link.U) }} - {{ link.N }} ( {{ get_host(link.U) }} )
{{ is_pkg(link.U) }}{{ link.T }} {{ get_host(link.U) }}( {{ get_host(link.U) }} )
{{ item.date }}
-
{{ is_pkg(link.U) }}{{ link.T }} {{ get_host(link.U) }} - {{ link.N }}
( {{ get_host(link.U) }} ){{ is_pkg(link.U) }}{{ link.T }} {{ get_host(link.U) }}
( {{ get_host(link.U) }} )
R Weekly 2018-45 Version, Communicating, Certification
Highlight
Insights
R in the Real World
R in Organizations
New Packages
CRAN
GitHub or Bitbucket
- shinipsum - Lorem-Ipsum-like Helpers for fast Shiny Prototyping
Package Releases
-
RcppAnnoy 0.0.11 - Annoy is a small, fast and lightweight library for Approximate Nearest Neighbours.
-
RcppTOML 0.1.5 - Small extensions
-
RcppRedis 0.1.9 - Provide R with read and write access to the Redis key-value store.
R Internationally
-
Análise do discurso dos candidatos, Fernando Haddad e Jair Bolsonaro
-
Manuel d’analyse spatiale — Théorie et mise en oeuvre pratique avec R
Tutorials
-
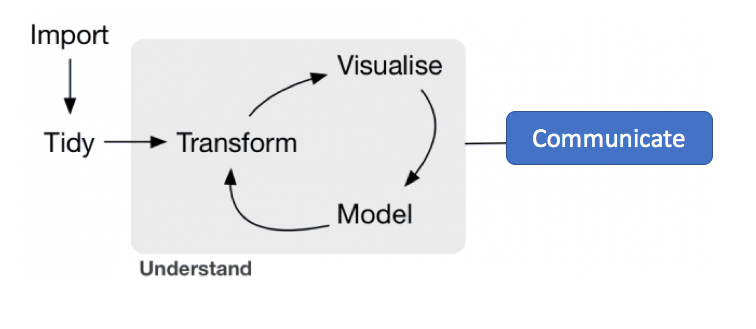
Writing a CV in markdown so it can be rendered as HTML, a PDF, and a Word document
-
Conway’s Game of Life in R: Or On the Importance of Vectorizing Your R Code
-
Analysis essentials: An example directory structure for an analysis using R
-
Use Pseudo-Aggregators to Add Safety Checks to Your Data-Wrangling Workflow
R Project Updates
Updates from R Core:
Upcoming Events in 3 Months
Events in 3 Months:
More past events at R conferences & meetups.
Call for Participation
Quotes of the Week
What does this #rstats code do if you run it in your head? (i.e. predict the result without using R or looking at the docs)
— Hadley Wickham (@hadleywickham) November 1, 2018
switch("b", a = 1, b = , c = 3)
Visualizing interstate migration for 2018-Q1 with #mapdeck.
— Samuel Wong (@SamueL_WonG_) October 31, 2018
Hit this link to play >> https://t.co/5go820muLO #rstats pic.twitter.com/p3xqMvFWQx
🧐Trying out ggplot 3.1.0's new features in my own, spatial way. #rstats
— Tyler Morgan-Wall (@tylermorganwall) October 30, 2018
(just built facet support into 🕶️#rayshader's 3D ggplots) pic.twitter.com/Kjk0dz2irA