Live
-
{{ is_pkg(link.U) }}{{ link.T }} {{ get_host(link.U) }} - {{ link.N }} ( {{ get_host(link.U) }} )
{{ is_pkg(link.U) }}{{ link.T }} {{ get_host(link.U) }}( {{ get_host(link.U) }} )
{{ item.date }}
-
{{ is_pkg(link.U) }}{{ link.T }} {{ get_host(link.U) }} - {{ link.N }}
( {{ get_host(link.U) }} ){{ is_pkg(link.U) }}{{ link.T }} {{ get_host(link.U) }}
( {{ get_host(link.U) }} )
R Weekly 2018-13 Codebook, WebAssembly, gofast
Highlight
-
codebook - Automatic Codebooks from Survey Metadata Encoded in Attributes
-
R-Podcast ep.25: Interview with Ian Lyttle and rstudio::conf 2018 wrap-up
-
gofast - go file abstract syntax tree r package
New Packages
CRAN
-
codebook - Automatic Codebooks from Survey Metadata Encoded in Attributes
-
h2o4gpu - Machine Learning with GPUs in R
-
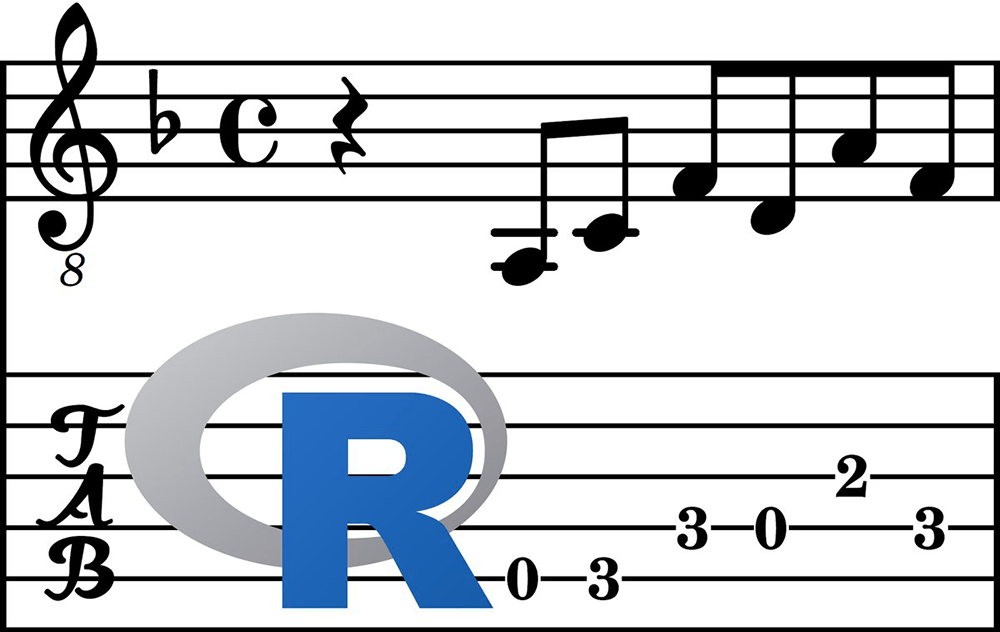
tabr - Guitar tabs with R

Package Releases
-
pmatch 0.1.3 - Pattern matching DSL for R
-
tailr 0.1.1 - Support for higher-order functions
-
auk 0.2.0 - eBird data extraction and processing
-
smoothr 0.0.1 - Spatial Feature Smoothing in R
-
RcppSMC 0.2.1 - Rcpp-based bindings to R for the Sequential Monte Carlo Template Classes
-
RSAGA 1.0.0 - An interface between R and the open-source geographic information system SAGA
-
RcppCNPy 0.2.9 - Read and write access to NumPy files
Resources
Videos and Podcasts
-
DataFramed ep.14: Text Mining and Natural Language Processing in Data Science (with Julia Silge)
-
R-Podcast ep.25: Interview with Ian Lyttle and rstudio::conf 2018 wrap-up
-
Linear Digression-20180318: How we pick projects for a professional data science team
-
Not So Standard Deviation ep.56: Only One of Us is Saving Daylight
Insights

Gist & Cookbook
R in Organizations
R in the Real World

-
PH Dengvaxia News Coverage: A Tidytext Mining Case Study Part 2
-
How did we get here? Three different Premier League stories.
R Internationally
Tutorials

-
Pipe tweenr - In this post we make some animated data visualisations using R and tweenr.
-
Body modification part 2: Automatically creating type checks for a function
-
Exploring the underlying theory of the chi-square test through simulation - part 1
-
Introduction to Scraping and Wranging Tables from Research Articles
-
gganimate vs. plotly… See how the two #rstats animation packages compare

-
Comparing additive and multiplicative regressions using AIC in R
-
Using stars for remote big Earth Observation data processing
-
gofast - go file abstract syntax tree r package
R Project Updates
Updates from R Core:
-
All packages are by default byte-compiled on installation. This makes the installed packages larger (usually marginally so) and may affect the format of messages and tracebacks (which often exclude
.Call and similar). -
The
"Date"and “date-time” classes"POSIXlt"and"POSIXct"now have a workinglength<-method, as wished in PR#17387. -
R has new serialization format (version 3) which supports custom serialization of
ALTREPframework objects. These objects can still be serialized in format 2, but less efficiently. Serialization format 3 also records the current native encoding of unflagged strings and converts them when de-serialized in R running under different native encoding. Format 3 comes with new serialization magic numbers (RDA3, RDB3, RDX3). Format 3 can be selected byversion = 3insave(),serialize()andsaveRDS(), but format 2 remains the default for all serialization and saving of the workspace. Serialized data in format 3 cannot be read in R prior to version 3.5.0. -
Using
\usage{ data(<name>, package="<pkg>") }no longer producesR CMD checkwarnings.
Upcoming Events in 3 Months
Events in 3 Months:
-
New York R conference Aprl 20-21
New York R conference, Discount Code : rladies -
eRum 2018 May 14-16
European R Users Meeting @ Budapest, Hungary -
R/Finance 2018 June 1 and 2
Applied Finance with R. -
CascadiaRConf June 2 Portland, OR, US
More past events at R conferences & meetups.
Call for Participation
Quotes of the Week
.@rweekly_org representatives at #sarRdayCapeTown 📬 pic.twitter.com/BXI5ZxpYId
— Maëlle Salmon 🐟 (@ma_salmon) 17 de març de 2018
.@brookLYNevery1: "But once I pushed this to Github, I immediately became an open source developer and maintainer. That’s all it takes." 🚀https://t.co/eWxF2lRqEa
— Maëlle Salmon 🐟 (@ma_salmon) 24 de març de 2018
💡 dplyr::case_when goes really well with geom_text (or ggrepel) for when you want to programmatically label a few of the most interesting features in your #rstats plots! And the criteria can be as complex as you want 🎉 pic.twitter.com/0jUp1uarde
— James Goldie (@rensa_co) March 21, 2018