Live
-
{{ is_pkg(link.U) }}{{ link.T }} {{ get_host(link.U) }} - {{ link.N }} ( {{ get_host(link.U) }} )
{{ is_pkg(link.U) }}{{ link.T }} {{ get_host(link.U) }}( {{ get_host(link.U) }} )
{{ item.date }}
-
{{ is_pkg(link.U) }}{{ link.T }} {{ get_host(link.U) }} - {{ link.N }}
( {{ get_host(link.U) }} ){{ is_pkg(link.U) }}{{ link.T }} {{ get_host(link.U) }}
( {{ get_host(link.U) }} )
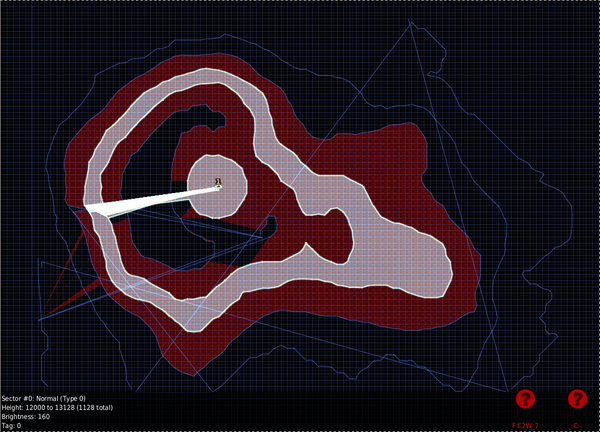
R Weekly 2024-W10 patching R, data.table survey, Doom plots
This week’s release was curated by Eric Nantz, with help from the R Weekly team members and contributors.
Highlight
Insights
R in Organizations
R in Academia
Resources
New Packages
CRAN
-
{ggsankeyfier} 0.1.7: Create Sankey and Alluvial Diagrams Using ‘ggplot2’
-
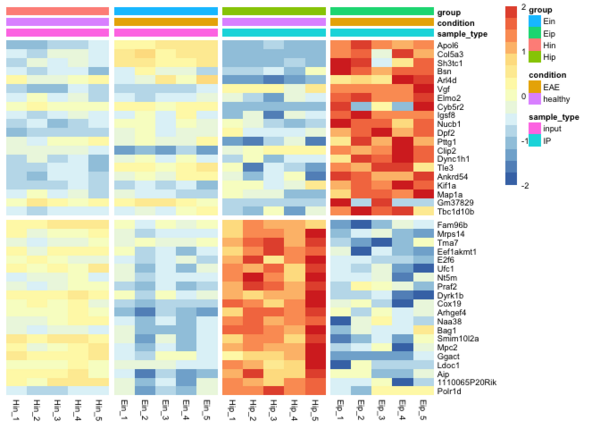
{tidyheatmaps} 0.2.1: Heatmaps from Tidy Data
-
{sanketphonetictranslator} 0.1.0: Phonetic Transliteration Between Hindi and English
-
{euroleaguer} 0.2.0: ‘Euroleague basketball API’
-
{tractor.base} 3.4.2: Read, Manipulate and Visualise Magnetic Resonance Images
-
{raybevel} 0.1.2: Generates Polygon Straight Skeletons and 3D Bevels

- {BayesPPDSurv} 1.0.2: Bayesian Power Prior Design for Survival Data
GitHub or Bitbucket
-
{verstappenr} 0.1.0: Did Max Verstappen finish first in the most recent F1 event?
-
{testpkg} 1.0: Experimental repo for offloading an R package’s test suite to a Git submodule
Updated Packages
-
{sysfonts} 0.8.8: Loading Fonts into R - diffify
-
{curl} 5.2.1: A Modern and Flexible Web Client for R - diffify
-
{nominatimlite} 0.3.0: Interface with ‘Nominatim’ API Service - diffify
-
{shinyWidgets} 0.8.2: Custom Inputs Widgets for Shiny - diffify
-
{GPUmatrix} 1.0.2: Basic Linear Algebra with GPU - diffify
-
{shinyMobile} 1.0.1: Mobile Ready ‘shiny’ Apps with Standalone Capabilities - diffify
-
{pointblank} 0.12.0: Data Validation and Organization of Metadata for Local and Remote Tables - diffify
-
{intendo} 0.1.1: A Group of Fun Datasets of Various Sizes and Differing Levels of Quality - diffify
-
{simhelpers} 0.2.1: Helper Functions for Simulation Studies - diffify
-
{RcppCWB} 0.6.4: ‘Rcpp’ Bindings for the ‘Corpus Workbench’ (‘CWB’) - diffify
-
{namer} 0.1.8: Names Your ‘R Markdown’ Chunks - diffify
-
{zdeskR} 0.4.0: Connect to Your ‘Zendesk’ Data - diffify
-
{qrng} 0.0-10: (Randomized) Quasi-Random Number Generators - diffify
-
{AmigaFFH} 0.4.5: Commodore Amiga File Format Handler - diffify
-
{parallelly} 1.37.1: Enhancing the ‘parallel’ Package - diffify
-
{ibmsunburst} 0.1.4: Generate Personality Insights Sunburst Diagrams - diffify
-
{retrosheet} 1.1.6: Import Professional Baseball Data from ‘Retrosheet’ - diffify
-
{gpboost} 1.3.0: Combining Tree-Boosting with Gaussian Process and Mixed Effects Models - diffify
-
{ggraph} 2.2.0: An Implementation of Grammar of Graphics for Graphs and Networks - diffify
-
{gganimate} 1.0.9: A Grammar of Animated Graphics - diffify
-
{datasauRus} 0.1.8: Datasets from the Datasaurus Dozen - diffify
-
{ggedit} 0.4.0: Interactive ‘ggplot2’ Layer and Theme Aesthetic Editor - diffify
Videos and Podcasts
Shiny Apps
Tutorials
R Project Updates
Updates from R Core:
Call for Participation
Updates from the R Contribution Working Group (RCWG):
- Announcing R Dev Day @ PLUS, Austria on Friday 12 July. Application deadline Sunday 24 March.
Upcoming Events in 3 Months
Events in 3 Months:
-
Join Us for an Evening of Growth and Grit: Data Mishaps Night
-
Join our R/Medicine Webinar: Quarto for Reproducible Medical Manuscripts
-
(March 6, 2024) Master Tidy Finance & Access Financial Data with Expert Christoph Scheuch
-
(April 17-19, 2024) Get Ready for ShinyConf 2024: Explore Keynotes & Secure Your Spot
-
Join our R/Medicine Webinar: Quarto for Reproducible Medical Manuscripts
Jobs
💼 Explore Jobs & Gigs Board on RStudio Community 💼
rtistry
Simple but attractive (my opinion!)#rstats #generativeart #plotter pic.twitter.com/TKzqs32CMq
— chris (@dickie_roper) March 3, 2024
Quotes of the Week
Teaching the reverse #rstats assignment operator -> 😎 pic.twitter.com/JcNfxVLv5u
— Lucy D’Agostino McGowan (@LucyStats) March 1, 2024