Live
-
{{ is_pkg(link.U) }}{{ link.T }} {{ get_host(link.U) }} - {{ link.N }} ( {{ get_host(link.U) }} )
{{ is_pkg(link.U) }}{{ link.T }} {{ get_host(link.U) }}( {{ get_host(link.U) }} )
{{ item.date }}
-
{{ is_pkg(link.U) }}{{ link.T }} {{ get_host(link.U) }} - {{ link.N }}
( {{ get_host(link.U) }} ){{ is_pkg(link.U) }}{{ link.T }} {{ get_host(link.U) }}
( {{ get_host(link.U) }} )
R Weekly 2024-W34 Git Merge, Community, Quarto Templates
This week’s release was curated by Eric Nantz, with help from the R Weekly team members and contributors.
Highlight
-
Please let me merge before I start crying and other things I’ve said at the Git terminal
-
A New R Community in Ahmedabad, India, focused on Clinical Research and Pharmaceutical Industries
Insights
-
Creating a sustainable open-source ecosystem: Lessons from an NSF Grant and the
#rstatshashtag -
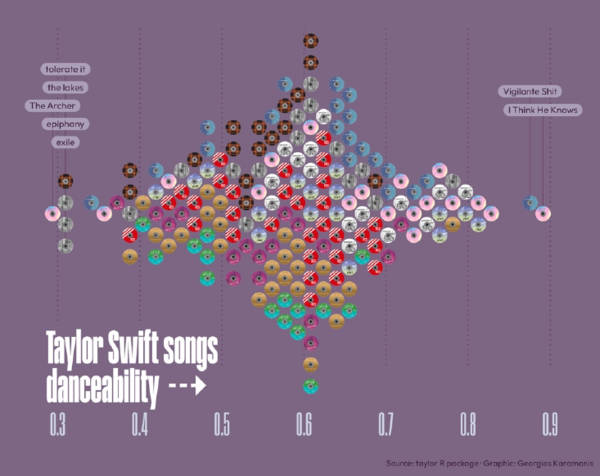
From idea to code to image: Creative data visualizations in R

R in the Real World

R in Academia
Resources
New Packages
📦 Keep up to date wtih CRANberries 📦
CRAN
CRAN submission will be offline from Aug 1, 2024 to Aug 16, 2024 (CRAN team vacation and maintenance work)
Updated Packages
-
{VeccTMVN} 1.0.0: Multivariate Normal Probabilities using Vecchia Approximation - diffify
-
{tm.plugin.mail} 0.3-0: Text Mining E-Mail Plug-in - diffify
-
{overtureR} 0.2.1: Load ‘Overture’ Datasets as ‘dbplyr’ and ‘sf’-Ready Data Frames - diffify
-
{metajam} 0.3.1: Easily Download Data and Metadata from ‘DataONE’ - diffify
-
{icosa} 0.11.1: Global Triangular and Penta-Hexagonal Grids Based on Tessellated Icosahedra - diffify
-
{cba} 0.2-25: Clustering for Business Analytics - diffify
-
{bimets} 4.0.2: Time Series and Econometric Modeling - diffify
-
{survobj} 3.1.1: Objects to Simulate Survival Times - diffify
-
{qualtRics} 3.2.1: Download ‘Qualtrics’ Survey Data - diffify
-
{solvebio} 2.15.0: The Official SolveBio API Client - diffify
-
{regressinator} 0.2.0: Simulate and Diagnose (Generalized) Linear Models - diffify
-
{nestedcv} 0.7.10: Nested Cross-Validation with ‘glmnet’ and ‘caret’ - diffify
-
{lingtypology} 1.1.18: Linguistic Typology and Mapping - diffify
-
{unittest} 1.7-0: TAP-Compliant Unit Testing - diffify
-
{StepReg} 1.5.2: Stepwise Regression Analysis - diffify
-
{serpstatr} 0.3.0: ‘Serpstat’ API Wrapper - diffify
-
{fluidsynth} 1.0.1: Read and Play Digital Music (MIDI) - diffify
-
{convevol} 2.2.1: Analysis of Convergent Evolution - diffify
-
{fastDummies} 1.7.4: Fast Creation of Dummy (Binary) Columns and Rows from Categorical Variables - diffify
-
{SISIR} 0.2.3: Select Intervals Suited for Functional Regression - diffify
-
{MethEvolSIM} 0.1.5: Simulate DNA Methylation Dynamics on Different Genomic Structures along Genealogies - diffify
-
{jqr} 1.3.4: Client for ‘jq’, a ‘JSON’ Processor - diffify
-
{V8} 5.0.0: Embedded JavaScript and WebAssembly Engine for R - diffify
-
{proteomicsCV} 0.3.0: Calculates the Percentage CV for Mass Spectrometry-Based Proteomics Data - diffify
-
{gpindex} 0.6.2: Generalized Price and Quantity Indexes - diffify
-
{ghapps} 1.1.0: Authenticate as a ‘GitHub’ App - diffify
-
{ecoreg} 0.2.5: Ecological Regression using Aggregate and Individual Data - diffify
-
{poweRbal} 0.0.1.1: Phylogenetic Tree Models and the Power of Tree Shape Statistics - diffify
-
{klassR} 0.2.4: Classifications and Codelists for Statistics Norway - diffify
-
{insight} 0.20.3: Easy Access to Model Information for Various Model Objects - diffify
-
{av} 0.9.1: Working with Audio and Video in R - diffify
-
{PriceIndices} 0.2.0: Calculating Bilateral and Multilateral Price Indexes - diffify
-
{incubate} 1.3.0: Parametric Time-to-Event Analysis with Variable Incubation Phases - diffify
-
{AATtools} 0.0.3: Reliability and Scoring Routines for the Approach-Avoidance Task - diffify
-
{rapidsplithalf} 0.3: A Fast Split-Half Reliability Algorithm - diffify
-
{gasfluxes} 0.7: Greenhouse Gas Flux Calculation from Chamber Measurements - diffify
-
{RcppEigen} 0.3.4.0.1: ‘Rcpp’ Integration for the ‘Eigen’ Templated Linear Algebra Library - diffify
-
{nlme} 3.1-166: Linear and Nonlinear Mixed Effects Models - diffify
-
{topicmodels} 0.2-17: Topic Models - diffify
-
{kernlab} 0.9-33: Kernel-Based Machine Learning Lab - diffify
-
{tm} 0.7-14: Text Mining Package - diffify
-
{tseries} 0.10-57: Time Series Analysis and Computational Finance - diffify
-
{Rpoppler} 0.1-3: PDF Tools Based on Poppler - diffify
Videos and Podcasts
Shiny Apps
R Internationally
Tutorials
-
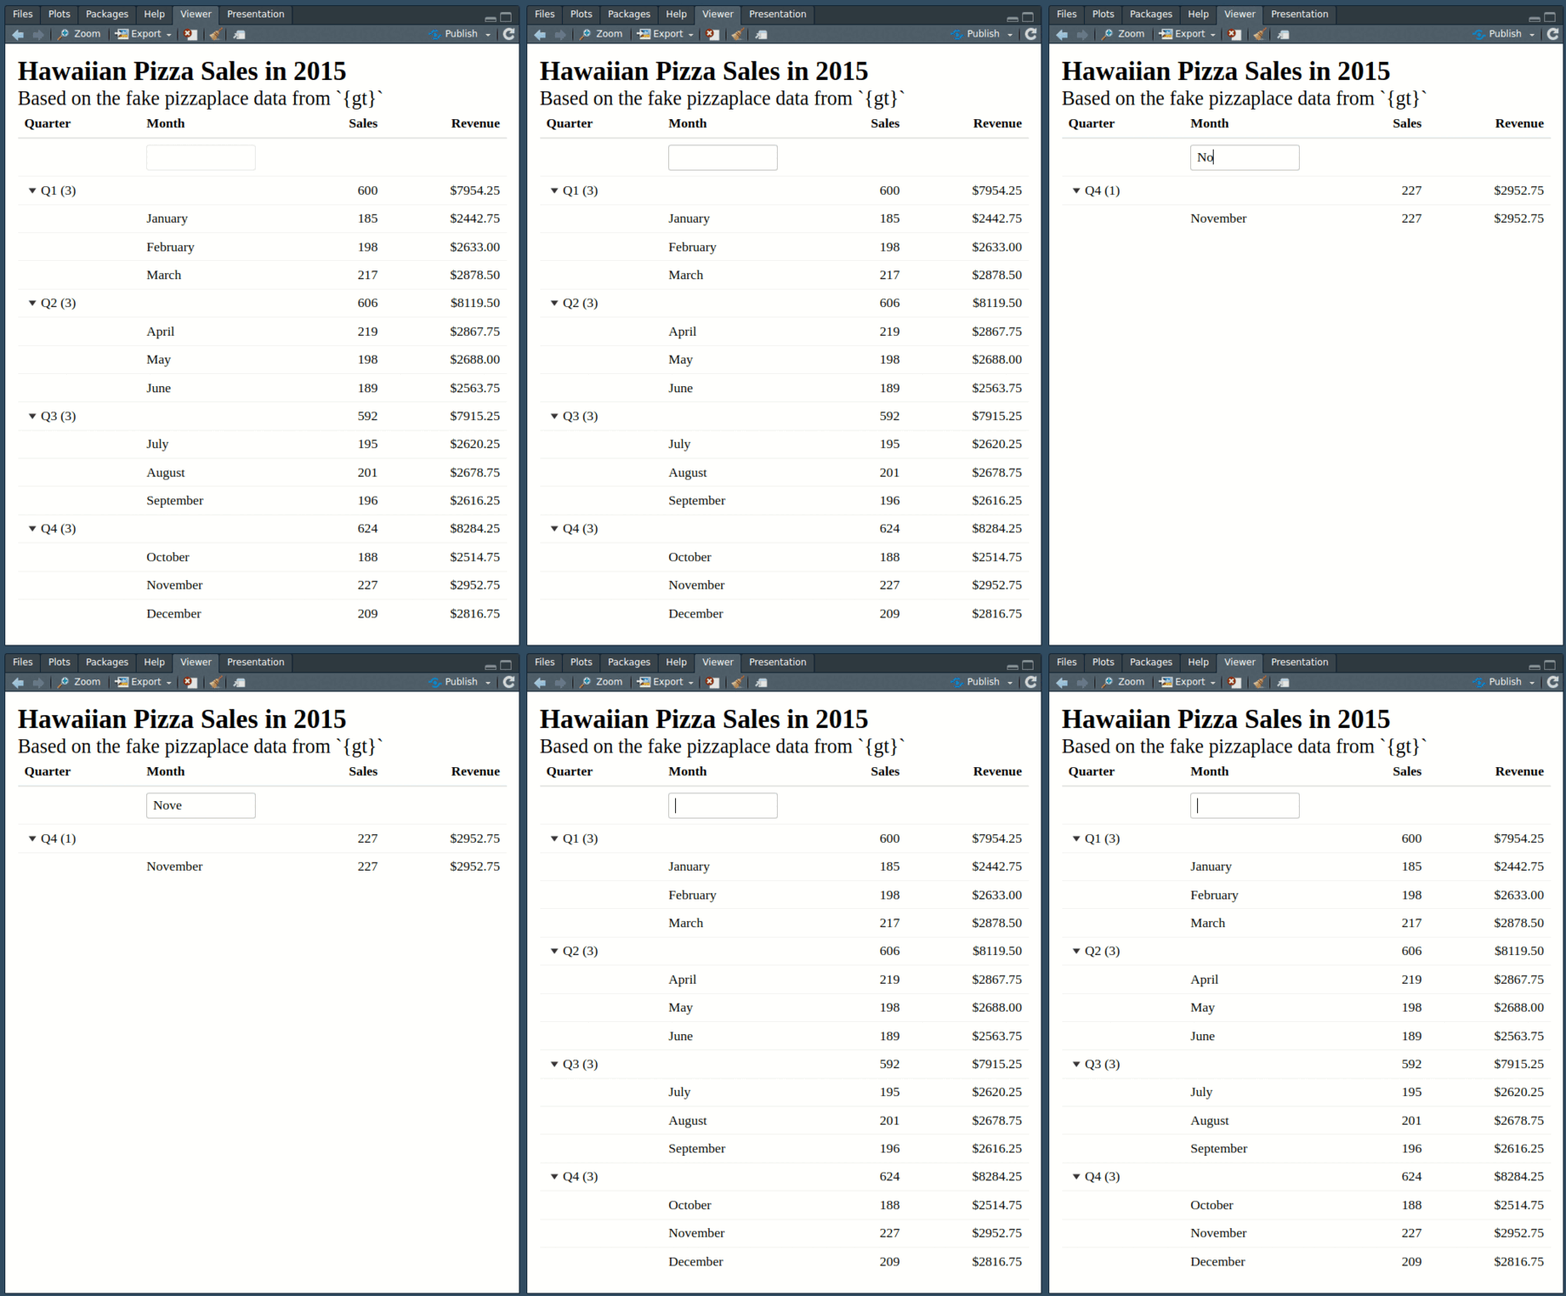
Report Design in R: Small tweaks that make a big difference
-
Mastering Matrix Concatenation in R: A Guide to rbind() and cbind()

R Project Updates
Updates from R Core:
Upcoming Events in 3 Months
Events in 3 Months:
Connect
Join the Data Science Learning Community