Live
-
{{ is_pkg(link.U) }}{{ link.T }} {{ get_host(link.U) }} - {{ link.N }} ( {{ get_host(link.U) }} )
{{ is_pkg(link.U) }}{{ link.T }} {{ get_host(link.U) }}( {{ get_host(link.U) }} )
{{ item.date }}
-
{{ is_pkg(link.U) }}{{ link.T }} {{ get_host(link.U) }} - {{ link.N }}
( {{ get_host(link.U) }} ){{ is_pkg(link.U) }}{{ link.T }} {{ get_host(link.U) }}
( {{ get_host(link.U) }} )
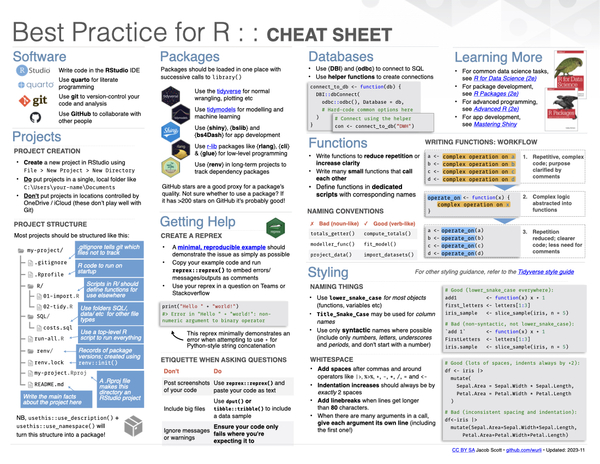
R Weekly 2024-W12 Patterns and anti-patterns, Shitty R help, and R Cheat Sheet
This week’s release was curated by Sam Parmar, with help from the R Weekly team members and contributors.
Highlight
Insights
-
Pre Self: what fraction of a journal’s papers are preprinted?
-
Unleash the Power of Your Data: Extend Excel with Python and R!


R in the Real World
R in Organizations
New Packages
tidychatmodels: Chat With All Kinds of AI Models Through a Common Interface
CRAN
- {mosaicCalc} 0.6.1: R-Language Based Calculus Operations for Teaching
- {palette} 0.0.2: Color Scheme Helpers
- {updateme} 0.1.0: Informative Messages About Outdated Packages
- {theftdlc} 0.1.0: Analyse and Interpret Time Series Features
- {ggbrick} 0.3.0: Waffle Style Chart with a Brick Layout in ‘ggplot2’
- {r2stl} 1.0.3: Visualizing Data using a 3D Printer
- {ciw} 0.0.1: Watch the CRAN Incoming Directories
- {xxhashlite} 0.2.2: Extremely Fast Hashing of R Objects, Raw Data and Files using ‘xxHash’ Algorithms
- {CompGR} 0.1.3: Complete Annual Growth Rate Generator
- {phoenix} 1.0.0: The Phoenix Pediatric Sepsis and Septic Shock Criteria
- {infoelectoral} 1.0.0: Download Spanish Election Results
- {link} 2024.4.0: Hyperlink Automatic Detection
- {rnames} 1.0.1: Recursive Display of Items in Nested Lists
- {rsleep} 1.0.12: Analysis of Sleep Data
- {SouthParkRshiny} 1.0.0: Data and ‘Shiny’ Application for the Show ‘SouthPark’
- {bandicoot} 1.0.0: Light-Weight ‘python’-Like Object-Oriented System
- {MSBStatsData} 0.0.2: Data Sets for Courses at the Münster School of Business
- {nycflights23} 0.1.0: Flights and Other Useful Metadata for NYC Outbound Flights in 2023
- {fillpattern} 1.0.1: Patterned Fills for ‘ggplot2’ and ‘grid’ Graphics
- {bibliorefer} 0.1.0: Generator of Main Scientific References
- {movegroup} 2024.03.05: Visualizing and Quantifying Space Use Data for Groups of Animals
- {iimi} 1.0.2: Identifying Infection with Machine Intelligence
GitHub or Bitbucket
-
{scimo} 0.0.1: Extra Recipes Steps For Dealing With Omics Data
Updated Packages
- {visachartR} 3.3.0: Wrapper for ‘Visa Chart Components’ - diffify
- {tinytex} 0.50: Helper Functions to Install and Maintain TeX Live, and Compile LaTeX Documents - diffify
- {teal.reporter} 0.3.1: Reporting Tools for ‘shiny’ Modules - diffify
- {sass} 0.4.9: Syntactically Awesome Style Sheets (‘Sass’) - diffify
- {visR} 0.4.1: Clinical Graphs and Tables Adhering to Graphical Principles - diffify
- {folders} 0.1.0: Standardized Folder Names - diffify
- {aifeducation} 0.3.2: Artificial Intelligence for Education - diffify
- {tfrmt} 0.1.1: Applies Display Metadata to Analysis Results Datasets - diffify
- {moodlequizR} 2.0.2: Easily Create Fully Randomized ‘Moodle’ Test Questions - diffify
- {flashr} 0.1.2: Create Flashcards of Terms and Definitions - diffify
- {topr} 2.0.1: Create Custom Plots for Viewing Genetic Association Results - diffify
- {formatdown} 0.1.3: Formatting Tools for ‘rmarkdown’ Documents - diffify
- {fable} 0.3.4: Forecasting Models for Tidy Time Series - diffify
- {s3fs} 0.1.5: ‘Amazon Web Service S3’ File System - diffify
- {NeuroDecodeR} 0.2.0: Decode Information from Neural Activity - diffify
- {feasts} 0.3.2: Feature Extraction and Statistics for Time Series - diffify
- {framecleaner} 0.2.1: Clean Data Frames - diffify
- {CDCPLACES} 1.1.5: Access the ‘CDC PLACES’ API - diffify
- {vivainsights} 0.5.2: Analyze and Visualize Data from ‘Microsoft Viva Insights’ - diffify
- {bigrquery} 1.5.1: An Interface to Google’s ‘BigQuery’ ‘API’ - diffify
- {contingencytables} 3.0.0: Statistical Analysis of Contingency Tables - diffify
- {cliot} 0.2.0: Clinical Indices and Outcomes Tools - diffify
- {evsim} 1.4.0: Electric Vehicle Charging Sessions Simulation - diffify
- {evprof} 1.1.2: Electric Vehicle Charging Sessions Profiling and Modelling - diffify
- {rnames} 1.0.1: Recursive Display of Items in Nested Lists - diffify
- {ggscidca} 0.1.9: Plotting Decision Curve Analysis with Coloured Bars - diffify
- {targets} 1.6.0: Dynamic Function-Oriented ‘Make’-Like Declarative Pipelines - diffify
- {Rd2md} 1.0.0: Markdown Reference Manuals - diffify
- {oaii} 0.5.0: ‘OpenAI’ API R Interface - diffify
- {deepdep} 0.4.3: Visualise and Explore the Deep Dependencies of R Packages - diffify
- {text2map} 0.1.9: R Tools for Text Matrices, Embeddings, and Networks - diffify
- {cansim} 0.3.16: Accessing Statistics Canada Data Table and Vectors - diffify
- {landsepi} 1.4.0: Landscape Epidemiology and Evolution - diffify
- {geomtextpath} 0.1.3: Curved Text in ‘ggplot2’ - diffify
- {tidyAML} 0.0.5: Automatic Machine Learning with ‘tidymodels’ - diffify
- {cffr} 1.0.0: Generate Citation File Format (‘cff’) Metadata for R Packages - diffify
- {arrow} 15.0.1: Integration to ‘Apache’ ‘Arrow’ - diffify
- {AllMetrics} 0.2.1: Calculating Multiple Performance Metrics of a Prediction Model - diffify
- {mdbr} 0.2.1: Work with Microsoft Access Files - diffify
- {f1dataR} 1.5.1: Access Formula 1 Data - diffify
- {tinytable} 0.1.0: Simple and Configurable Tables in ‘HTML’, ‘LaTeX’, ‘Markdown’, ‘Word’, ‘PNG’, ‘PDF’, and ‘Typst’ Formats - diffify
- {Rd2roxygen} 1.15: Convert Rd to ‘Roxygen’ Documentation - diffify
- {arcpullr} 0.2.9: Pull Data from an ‘ArcGIS REST’ API - diffify
- {nonmem2R} 0.2.5: Loading NONMEM Output Files with Functions for Visual Predictive Checks (VPC) and Goodness of Fit (GOF) Plots - diffify
- {gcplyr} 1.9.0: Wrangle and Analyze Growth Curve Data - diffify
- {openair} 2.18-2: Tools for the Analysis of Air Pollution Data - diffify
- {usa} 0.1.2: Updated US State Facts and Figures - diffify
- {tm} 0.7-12: Text Mining Package - diffify
- {srt} 1.0.4: Read Subtitle Files as Tabular Data - diffify
- {metro} 0.9.3: Washington Metropolitan Area Transit Authority API - diffify
- {tidyselect} 1.2.1: Select from a Set of Strings - diffify
- {epiR} 2.0.70: Tools for the Analysis of Epidemiological Data - diffify
- {digest} 0.6.35: Create Compact Hash Digests of R Objects - diffify
- {theft} 0.6.1: Tools for Handling Extraction of Features from Time Series - diffify
- {greta} 0.4.5: Simple and Scalable Statistical Modelling in R - diffify
- {gluedown} 1.0.9: Wrap Vectors in Markdown Formatting - diffify
- {fflr} 2.2.3: Retrieve ESPN Fantasy Football Data - diffify
- {duckplyr} 0.3.1: A ‘DuckDB’-Backed Version of ‘dplyr’ - diffify
Call for Participation
- 2024 DuckDB User Survey (as featured on https://duckdb.org)
Videos and Podcasts
- Listen to the R-Weekly Highlights Podcast
- Use CSS Selection to Style Existing HTML Code
- R Shiny in Life Sciences – Top 7 Dashboard Examples by Ismael Rodriguez
R Internationally
Tutorials
- WebDev4R: CSS Selection
-
Introducing tidychatmodels for communicating with AI chatbots
-
Bird’s Eye View: using R to generate inventory maps for lab reagents
- Mastering Random Sampling in R with the sample() Function
- Wrangling Names in R: Your Guide to the make.names() Function
-
Object Oriented Programming in R (Part 3): A Practical Guide to the S4 System
- How To Write E2E Tests Selectors That Stand The Test Of Time
R Project Updates
Updates from R Core:
Updates from the R Contribution Working Group (RCWG):
- Announcing R Dev Day @ Imperial, London, UK on Friday 26 April. Registration deadline Sunday 14 April.
Upcoming Events in 3 Months
Events in 3 Months:
Grants & Funding
Datasets
Jobs
💼 Explore Jobs & Gigs Board on RStudio Community 💼
rtistry
Heres a look at how I wrote an implementation of the rolling shutter effect in #rstats
— chris (@dickie_roper) March 15, 2024
Worked example in the repo: https://t.co/Vod9oQtYwz pic.twitter.com/DlfVg2Q35g
#rstats #rspatial and other #geospatial folks, I am pleased to announce the {centerline} package! It's a small but powerful tool that can find a centerline of closed polygons. https://t.co/hMYYpYT6a3 pic.twitter.com/dix2pVm3n7
— Anatolii Tsyplenkov (@atsyplen) March 16, 2024
Roads of Hokkaidō. This was a trial render that took a good 1.5 hours just to draw the over 600k linestrings. Don't want to think how long it'll think to path trace so here's the draft render. Will try overnight, maybe.#rayshader adventures, an #rstats tale pic.twitter.com/xUFJpyAyPn
— tterence on bsky (@researchremora) March 12, 2024