R Weekly 2018-33 Diversity, Books
Highlight
-
The best books on Computer Science for Data Scientists recommended by Hadley Wickham
-
scales 1.0.0 - Scale Functions for Visualization
New Packages
CRAN
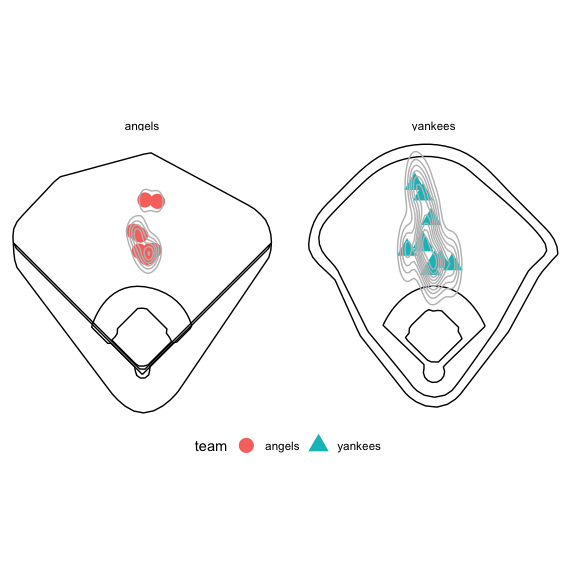
- GeomMLBStadiums - Geoms to draw MLB stadiums in ggplot2
GitHub or Bitbucket
- causalpie - An R Package for easily creating and visualizing sufficient-component causal models
Package Releases
-
fitur 0.6.0 - Fit Univariate Distributions
-
RQuantLib 0.4.5 - Windows is back, and small updates
-
scales 1.0.0 - Scale Functions for Visualization
Insights
R in Organizations
R in the Real World

Resources
Tutorials
-
Installation of R 3.5 on Ubuntu 18.04 LTS and tips for spatial packages
-
Beyond Basic R - Plotting with ggplot2 and Multiple Plots in One Figure
-
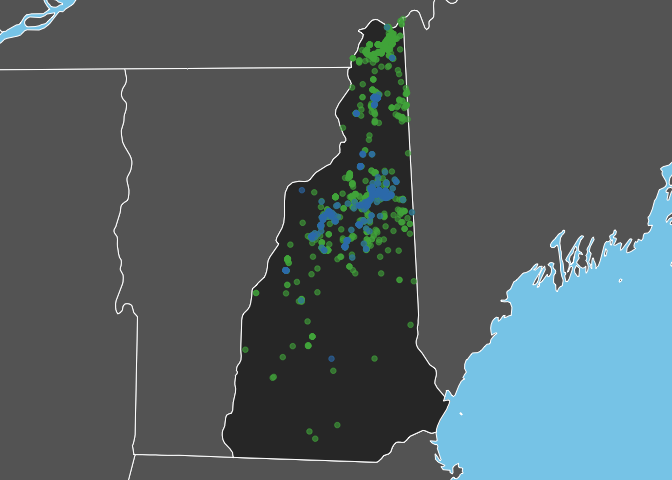
How to (quickly) enrich a map with natural and anthropic details
Upcoming Events in 3 Months
Events in 3 Months:
-
SatRday Aug 31-Sept 1
Amsterdam, the Netherlands. -
LatinR 2018 Sept 4-5
Buenos Aires, Argentina. -
Econometrics and Statistics using R Sept 10-14
Lisbon, Portugal.
More past events at R conferences & meetups.
Call for Participation
Quotes of the Week
Made this with mapdeck while working on some project. Thought sharing a video is more compelling than sharing an image. #rstats pic.twitter.com/8vB5fY2ZNW
— Samuel Wong (@SamueL_WonG_) August 4, 2018
Visualize the vertical change of your 🚴♀️ bike/running routes with 🕶️#rayshader! Proof of concept: #rstats pic.twitter.com/tkNt7S4WSw
— Tyler Morgan-Wall (@tylermorganwall) August 2, 2018