R Weekly 2018-32 Basic, Generation
Highlight
New Packages
CRAN
-
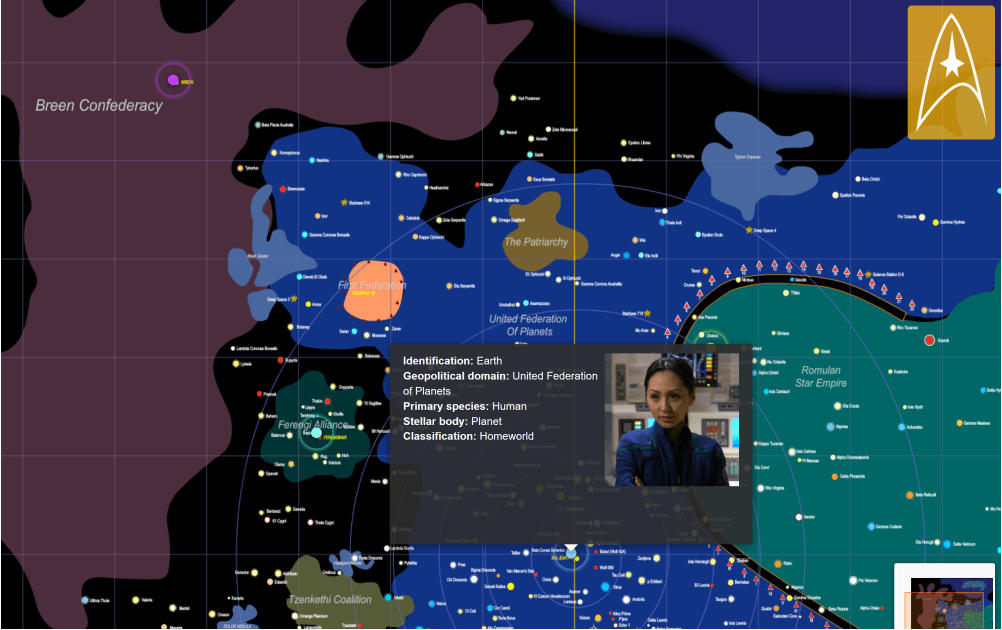
bigreadr: Read large text files by splitting them in smaller parts.
-
cleandata - Collection of functions to Inspect, Impute, and Encode Data
-
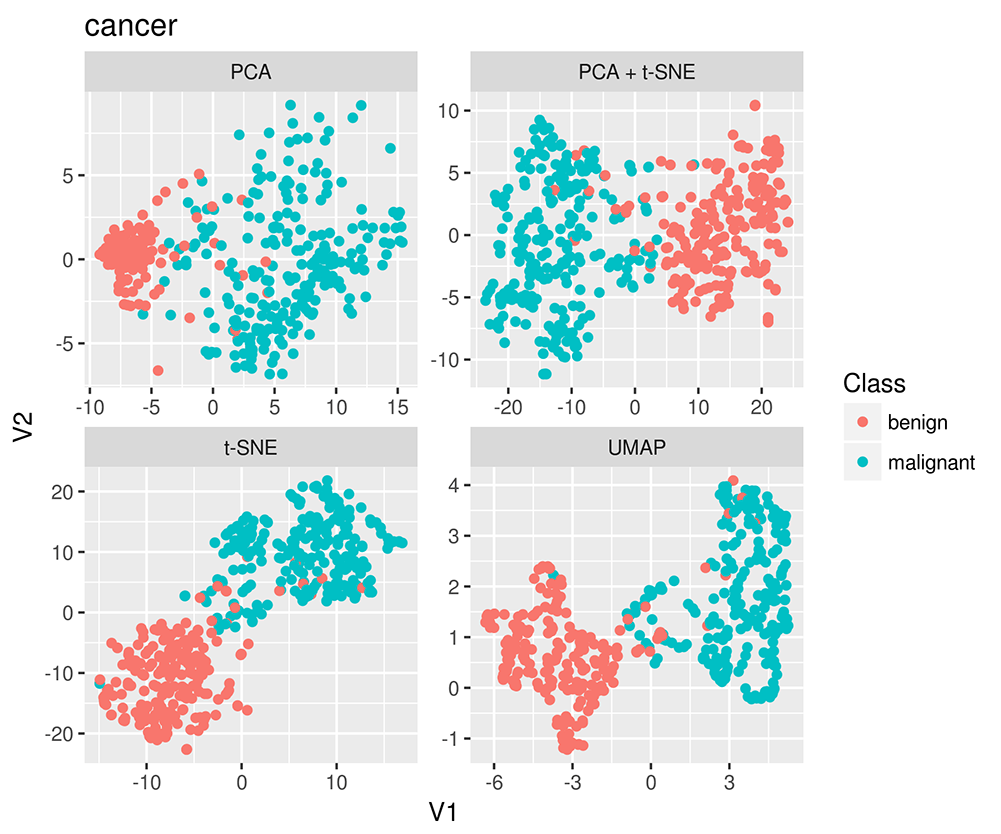
umapr - A package for dimensionality reduction of large data
Insights
R in Organizations
R in the Real World
Tutorials
-
When interaction is not interaction: confounding and measurement error - Mismeasuring variables and their covariates can sometimes make it appear as if there’s interaction between them when there is not.
-
Making static and dynamic maps using inlmisc - an R package developed by researchers at the United States Geological Survey (USGS) Idaho National Laboratory (INL) Project Office
-
Create a cheap, disposable supercomputer with R, DigitalOcean, Docker, and future / furrr
-
Highlighting with ggplot2: The Old School and New School Way
-
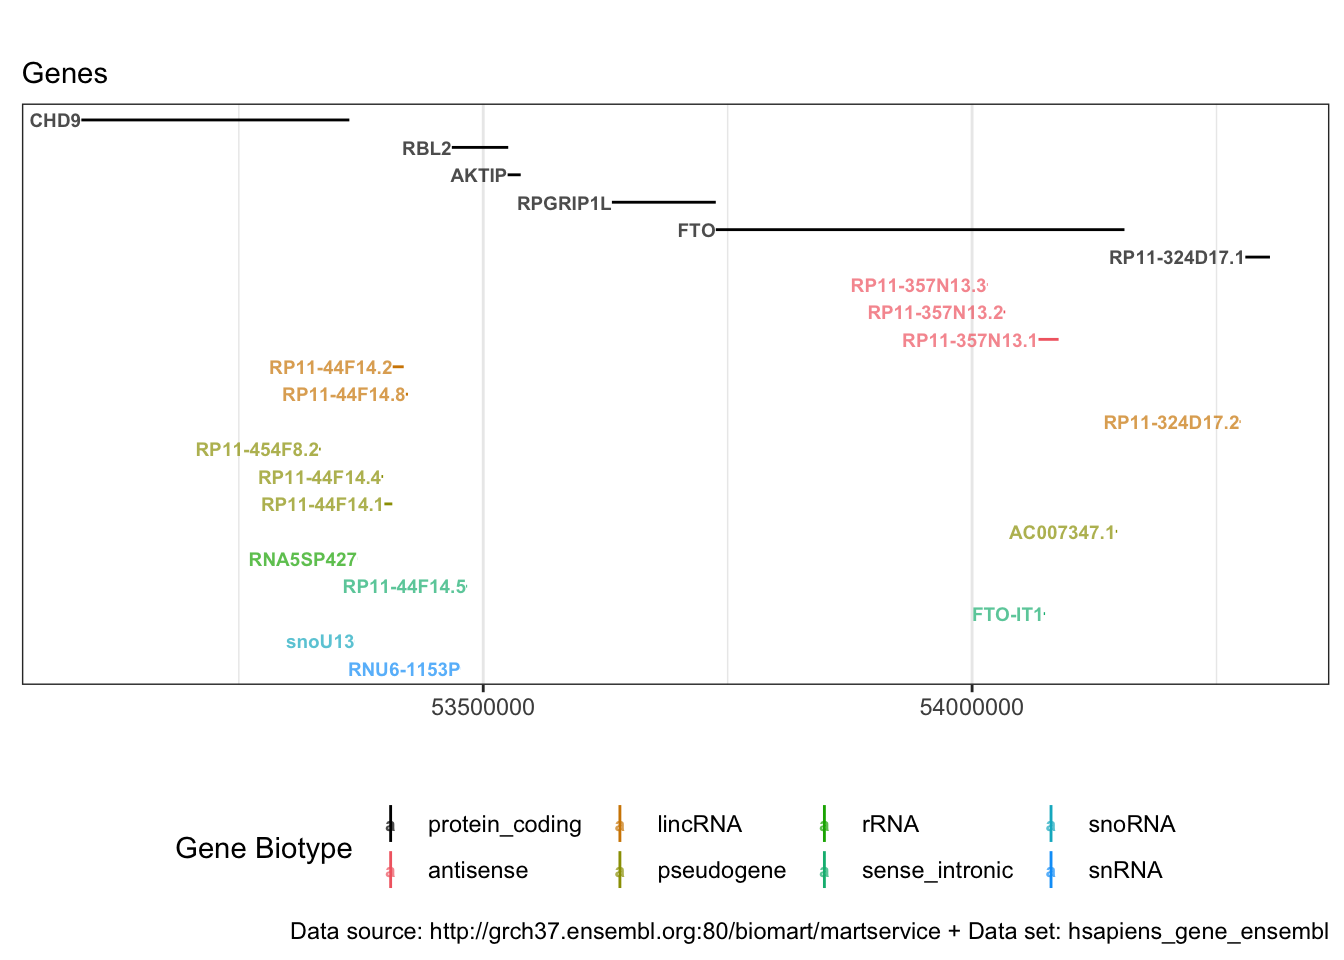
Zooming into GWAS summary statistics: How to annotate and visualise summary statistics from genome-wide association studies using the R-package
biomaRt.
-
A quick introduction and tutorial on a cool social network analysis model for influence
-
Video: How to run R and Python in SQL Server from a Jupyter notebook
Upcoming Events in 3 Months
Events in 3 Months:
-
SatRday Aug 31-Sept 1
Amsterdam, the Netherlands. -
LatinR 2018 Sept 4-5
Buenos Aires, Argentina. -
Econometrics and Statistics using R Sept 10-14
Lisbon, Portugal.
More past events at R conferences & meetups.
Call for Participation
Quotes of the Week
TIL — You can add tabs in your RMarkdown document by adding `{.tabset}` in your header. All sub-headers will then appear in a tab instead of alone 😎#RStats #RMarkdown pic.twitter.com/4xPEHPph6h
— Colin Fay 🤘 (@_ColinFay) August 1, 2018
I try to write low dependency #rstats pkgs, but this is only possible b/c R has so much built-in: stats, string manip, low/high level graphics, etc. And it is stable over time; a bedrock to build on. Me when I think about it: 🤯.
— BrodieG (@BrodieGaslam) July 31, 2018
Thank you R-Core!