R Weekly 2018-31 Gifski, Question, Educator
Highlight
-
Gifski - the fastest GIF encoder in the universe
-
rOpenSci Educators Collaborative: What Educational Resources Work Well and Why?
-
Should R Consortium Recommend CII Best Practices Badge for R Packages: Latest Survey Results
New Packages
CRAN

Package Releases
-
future 1.9.0 - Unified Parallel and Distributed Processing in R for Everyone. A major milestone release: Standard output is now relayed back to the master R session.
Insights
-
rOpenSci Educators Collaborative: What Educational Resources Work Well and Why?
-
rOpenSci Educators Collaborative: What Are The Challenges When Teaching Science With R?
-
rOpenSci Educators Collaborative: How Can We Develop a Community of Innovative R Educators?
R in Organizations
R in the Real World

Tutorials


-
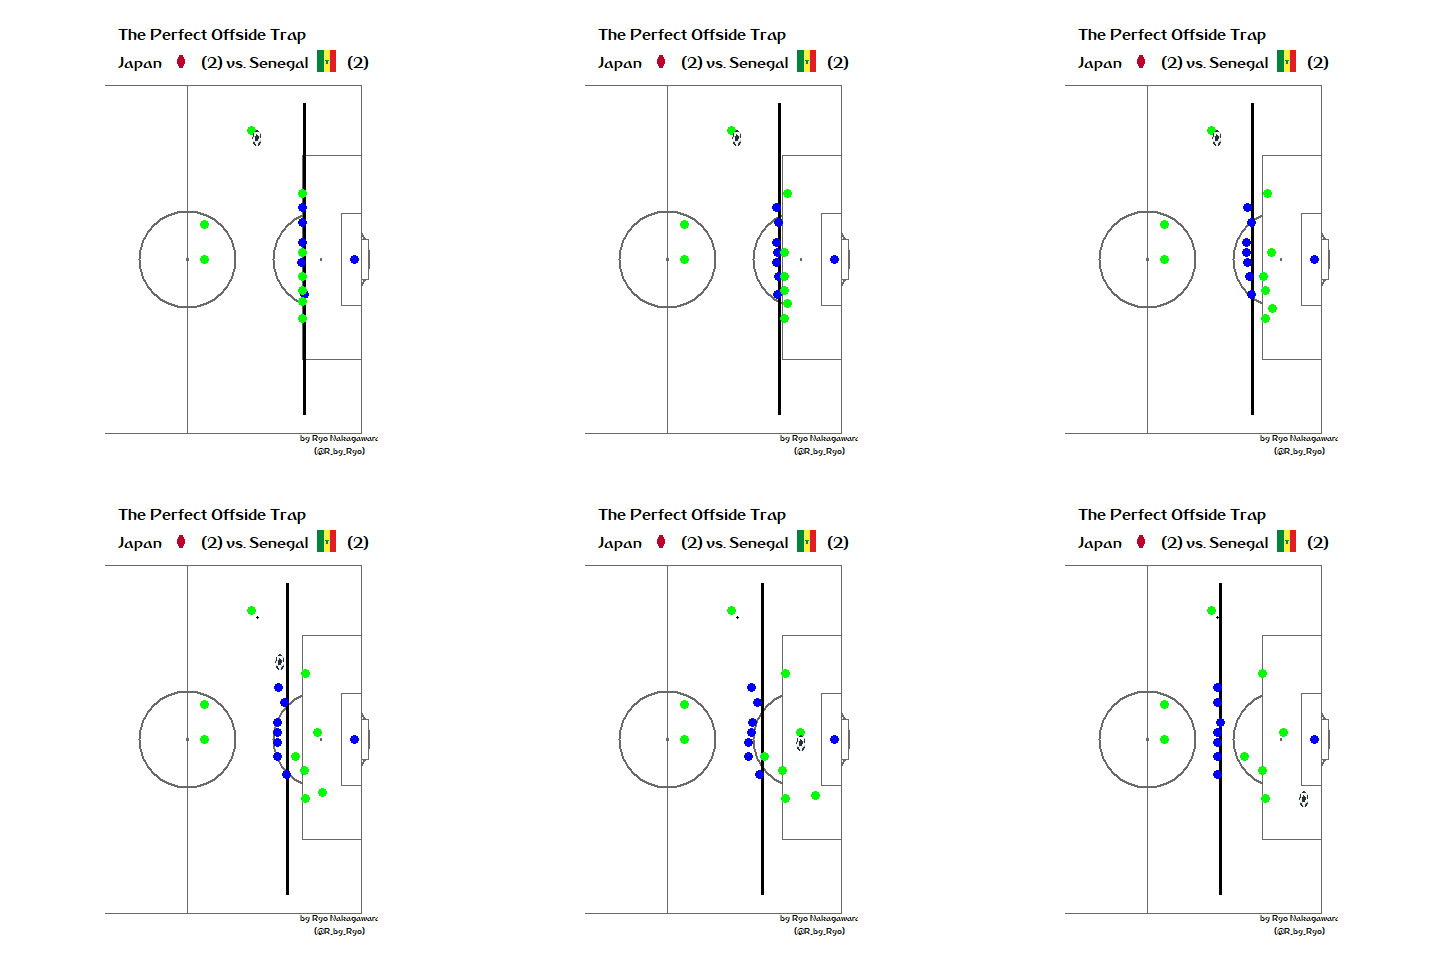
Animating the Goals of the World Cup: Comparing the old vs. new gganimate and tweenr API!
-
Slowly but Steadily, They Started to Help Me Answer Questions
-
Arthur blinked, Ford shrugs, but Zaphod leapt; text as graph

-
Machine Learning Results in R: one plot to rule them all! (Part 2 – Regression Models)
-
Real-time data visualization using R and data extracting from SQL Server
Upcoming Events in 3 Months
Events in 3 Months:
-
SatRday Aug 31-Sept 1
Amsterdam, the Netherlands. -
LatinR 2018 Sept 4-5
Buenos Aires, Argentina. -
Econometrics and Statistics using R Sept 10-14
Lisbon, Portugal.
More past events at R conferences & meetups.
Call for Participation
Quotes of the Week
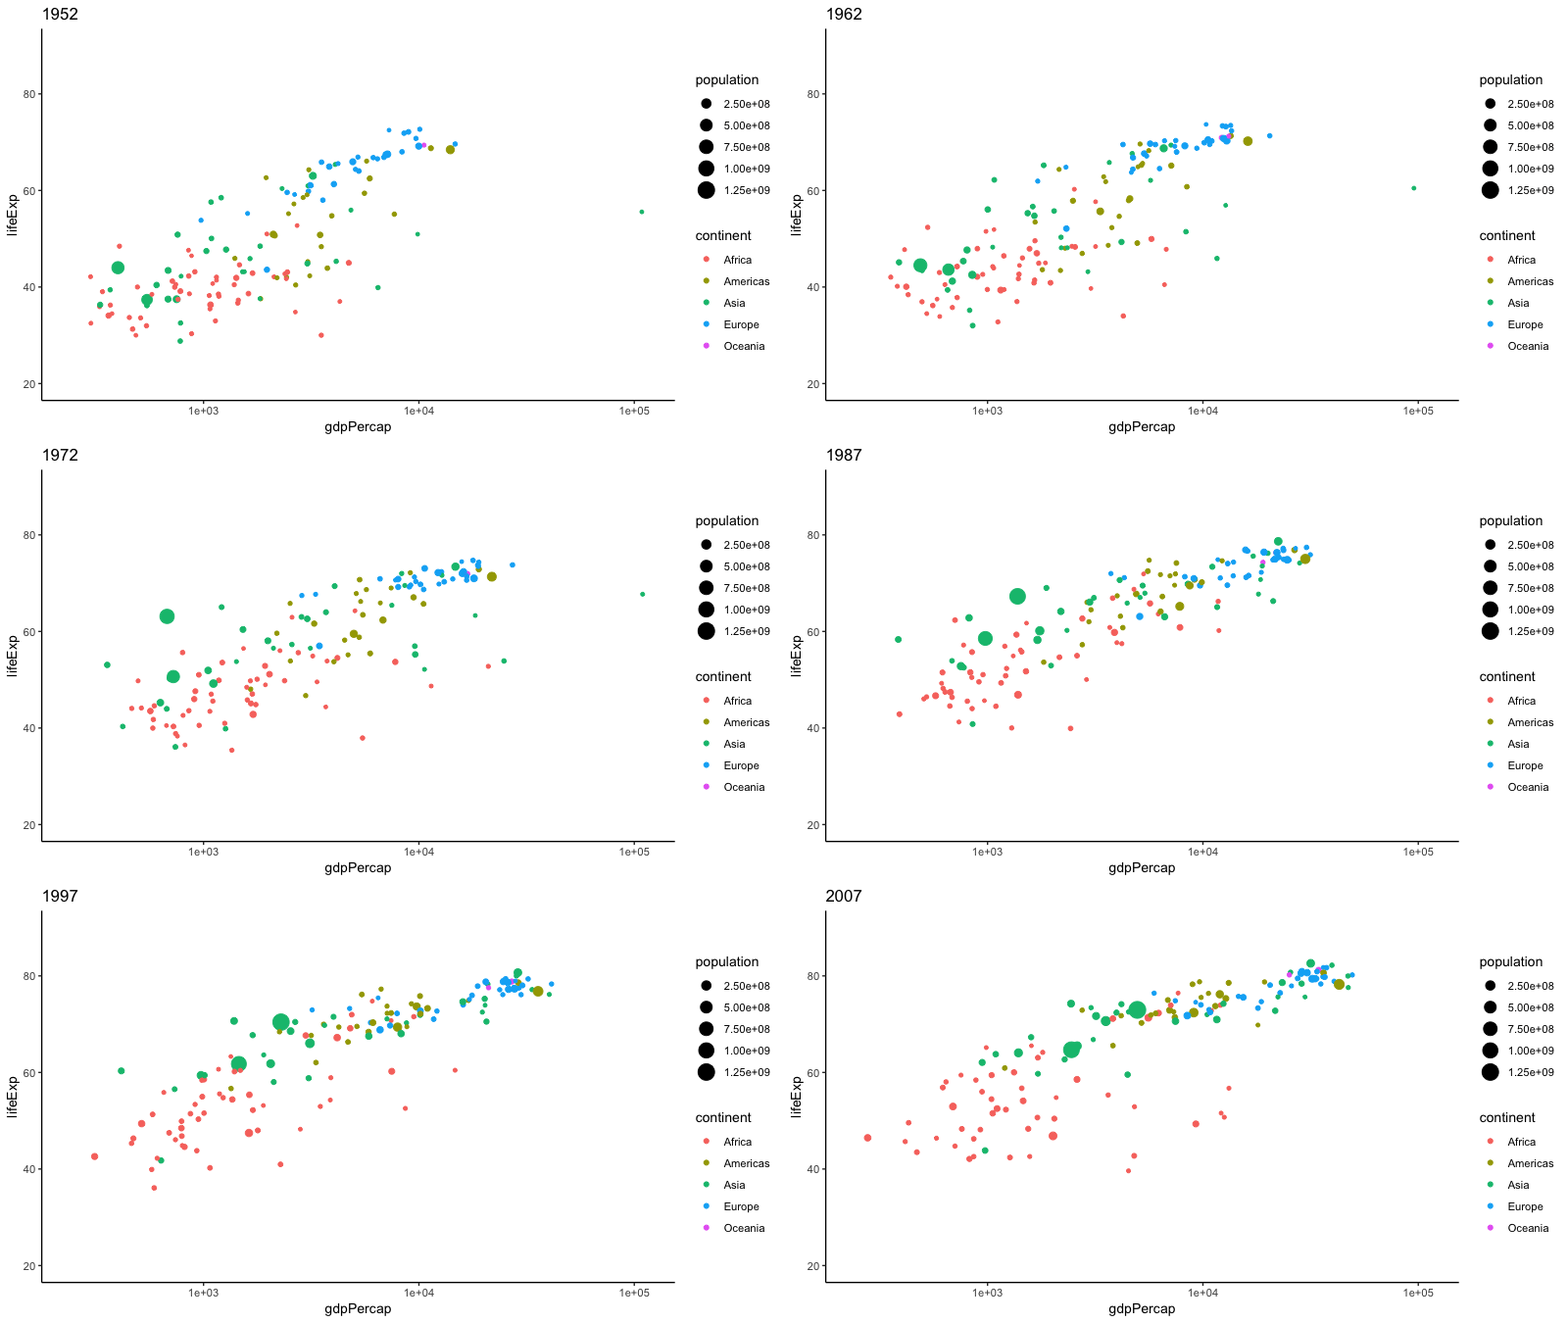
Truth #rstats pic.twitter.com/2YNApUZtCu
— Sam Williams (@_sam_williams_) July 27, 2018
Had no idea that you could pull a Google map in one line of code and use ggplot2 to add layers to it until @LittleMissData just blew my mind. 💯 #rstats pic.twitter.com/41E4Gf2rDY
— Caitlin Hudon👩🏼💻 (@beeonaposy) July 26, 2018
1/4
— Tyler Morgan-Wall (@tylermorganwall) July 23, 2018
“So that plot is an—“
“Yep, elevation map.”
“And this plot is also a—“
“Yep, also an elevation map.”
“So are you seriously telling me you turned all these plots into—“
“Elevation maps. It’s elevation maps all the way down.”
Preview: 3D ggplots w/🕶️#rayshader 😉#rstats pic.twitter.com/9boxiRzOzr
