R Weekly 2018-30 UseR! 2018
Highlight
New Packages
CRAN
- Stickylabeller - easily include summary statistics and even automatically number/letter your facets for use in papers and reports
Package Releases
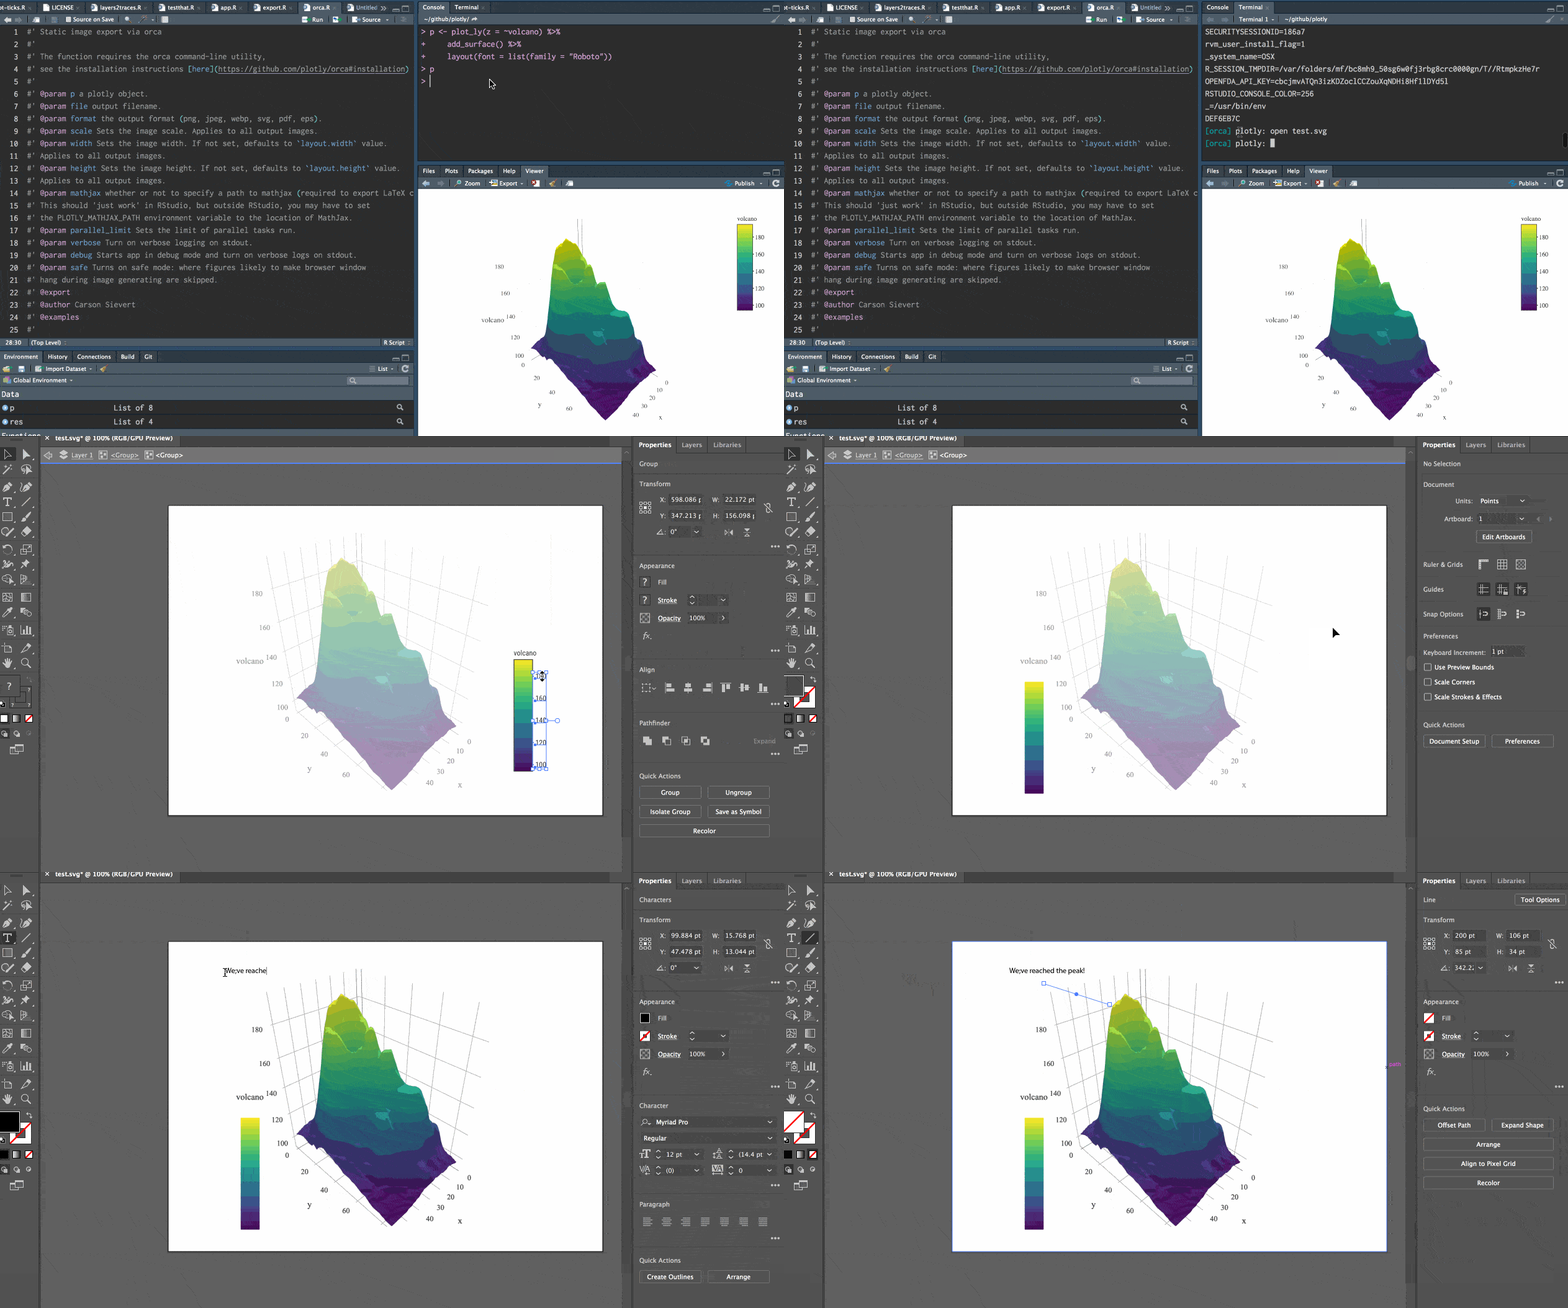
- plotly 4.8.0 - Create Interactive Web Graphics via ‘plotly.js’

-
fst 0.8.0 - Lightning fast serialization of data frames using the fst package
-
R.devices 2.16.0 - Unified Handling of Graphics Devices
Insights
R in the Real World

-
Alleviating AWS Athena Aggravation with Asynchronous Assistance
-
This post talks about using Random Forests to model the Number of Votes a Zomato restaurant gets.
-
Recreating (more) data visualizations from the book “Knowledge is Beautiful”: Part IV
-
Don’t Worry: Google Only Checks Your Location Every 10 Minutes

Videos and Podcasts
R in Organizations
Tutorials

-
What’s inside? pkginspector provides helpful tools for inspecting package contents
-
Explaining Black-Box Machine Learning Models - Code Part 1: tabular data caret

Upcoming Events in 3 Months
Events in 3 Months:
-
LatinR 2018 Sept 4-5
Buenos Aires, Argentina. -
Econometrics and Statistics using R Sept 10-14
Lisbon, Portugal.
More past events at R conferences & meetups.
Call for Participation
- Econometrics and Statistics using R - Econometrics and Statistics usin R is organized in 5 training days that will provide you a full set of tools and techniques that any modern applied researcher needs to know. 10-14 September - Lisbon, Portugal
Quotes of the Week
😳 Thanks to the @RConsortium, I'm gonna need a solid month to get through all the 📹 awesomeness from @useR2018_conf… https://t.co/kzKWI6W5cf #rstats #useR2018 pic.twitter.com/wlHvqKbulM
— Mara Averick (@dataandme) July 16, 2018
How I stopped worrying about formatting regression analyses tables and learned to love the `ggcoefstats` function (https://t.co/pn9YtXOI2i)
— Indrajeet Patil (@patilindrajeets) July 12, 2018
ICYWW, this is unpublished data where we fail to replicate the finding that autistics morally judge accidental harms more severely#rstats pic.twitter.com/cPxbk4E2to
#gganimate is fantastic! It just works. So many GIFs to make for upcoming stats textbook. Here's one showing how pseudo-correlations arise due to sampling error (when two random variables are drawn from a uniform distribution) as a function of sample-size (10,50,100,1000) #rstats pic.twitter.com/U5K0ngQ4v1
— Matt Crump (@MattCrump_) July 15, 2018