R Weekly 2018-47 Vulnerability, Tables
Highlight
Insights
R in the Real World

-
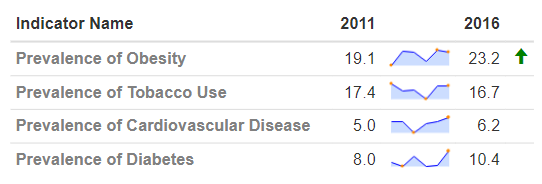
Getting Census data from multiple years using tidycensus and purrr
-
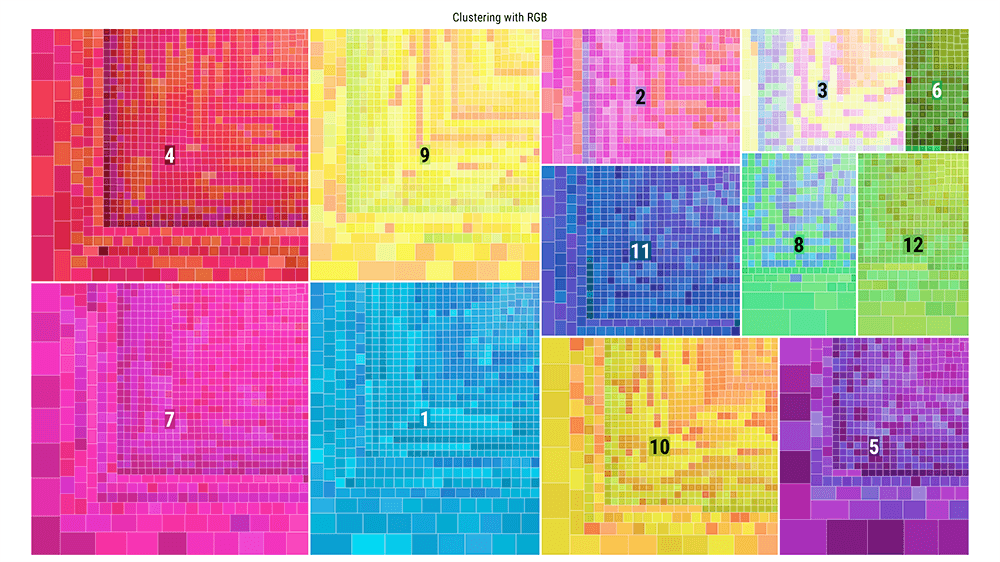
Utilizing K-means to Extract Colours from Your Favourite Images


R in Organizations

Resources
New Packages
CRAN
-
Shiny 1.2.0 - Plot caching
-
RcppGetconf 0.0.3 - package for reading system configuration
Tutorials

-
Data Science Blog: My Experiences with Data Science, Blogging, and R
-
Easy time-series prediction with R: a tutorial with air traffic data from Lux Airport

-
A Mathematician’s Perspective on Topological Data Analysis and R
-
Using a genetic algorithm for the hyperparameter optimization of a SARIMA model
Upcoming Events in 3 Months
Events in 3 Months:
More past events at R conferences & meetups.
Call for Participation
Quotes of the Week
A lesser-known #dplyr 🔧 function: lag(). Use lag() to get the previous value in a vector. The equivalent for getting the next value is lead(). I've not used them often, but when I have they've saved me from writing horrible workarounds! #rstats #tidyverse pic.twitter.com/b29Bwbymzr
— Nic Crane (@nic_crane) November 16, 2018
TIL tidyr::uncount(), which does the opposite of dplyr::count()#RStats pic.twitter.com/ePoOgYlX8b
— Colin Fay 🤘 (@_ColinFay) November 16, 2018
#rstats folks: did you know enclosing assignments inside parentheses will also print the object's value to the console? One area this can be useful is when assigning #ggplot2 objects: Eg:
— John Lewis (@_jrlewi) November 15, 2018
(p <- ggplot(...) + ...)
will assign and display your plot in one line.
What are your favourite non-tidyverse #rstats packages? I ❤️ #kableExtra by @haozhu233. It allows you to get a really fine degree of customisation on both LaTeX and HTML tables, and wins bonus points for having excellent documentation! 😻https://t.co/H3urFGgZYh pic.twitter.com/5tGrrWejAj
— We are R-Ladies (@WeAreRLadies) November 16, 2018