R Weekly 2019-20 stringr, reproducible research, redoc
Release Date: 2019-05-20
Highlight
-
New
stringrvignette comparing base string functions to their stringr equivalents -
redoc, reversible reproducible documents. redoc is a package to enable a collaboration via a two-way R Markdown-Microsoft Word workflow. Includes support for diffing, Critic Markup/track changes, and RStudio Add-ins.
Insights
R in the Real World
R in Organizations
R in Academia
Resources
-
New
stringrvignette comparing base string functions to their stringr equivalents -
drakeplanner, a web app to create new drake projects -
Interactive web-based data visualization with R, plotly, and shiny (book)
-
Data and code page on Alex Albright’s website. Features data/code for replicating & building on articles about everything from Oscars speeches to names of cats/dogs. Also features a smorgasbord of resources regarding R, websites, CVs, etc.
New Packages
CRAN
-
vaultrfor storing and interacting with secrets and sensitive data using HashiCorp’s Vault -
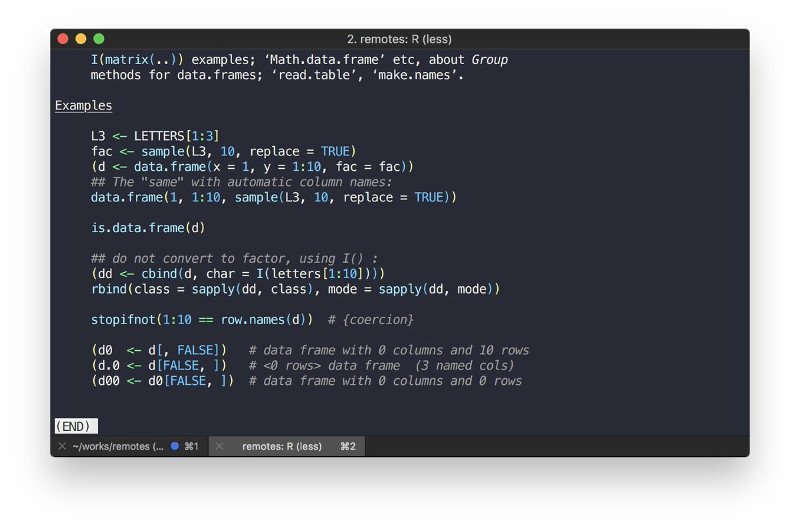
rdoccolourised R docs in the terminal
GitHub or Bitbucket
-
redoc, reversible reproducible documents. redoc is a package to enable a collaboration via a two-way R Markdown-Microsoft Word workflow. Includes support for diffing, Critic Markup/track changes, and RStudio Add-ins. -
g2r, grammar of graphics for interactive visualisations -
distributions, Probability Distributions as S3 Objects -
fastmap, fast implementation of a key-value store -
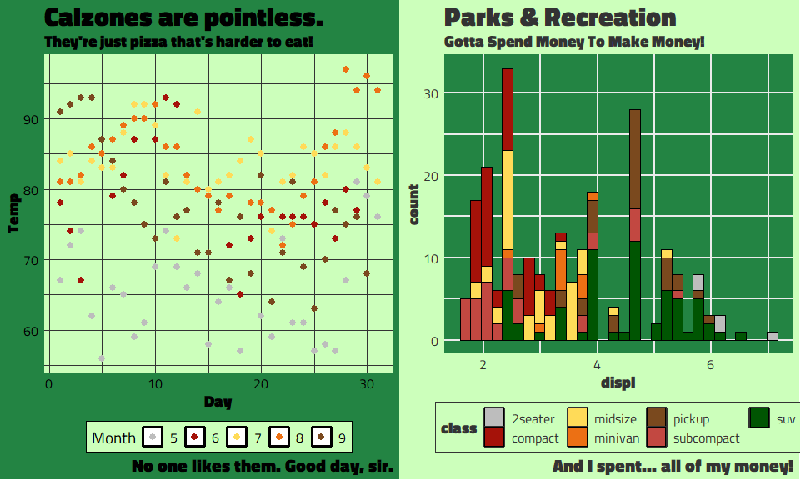
Introducing {tvthemes}: ggplot2 palettes and themes from your favorite TV shows!
Updated Packages
-
diffobj0.2.3, Compare R Objects with a Diff -
vroom1.0.1, Read and Write Rectangular Text Data Quickly
Tutorials
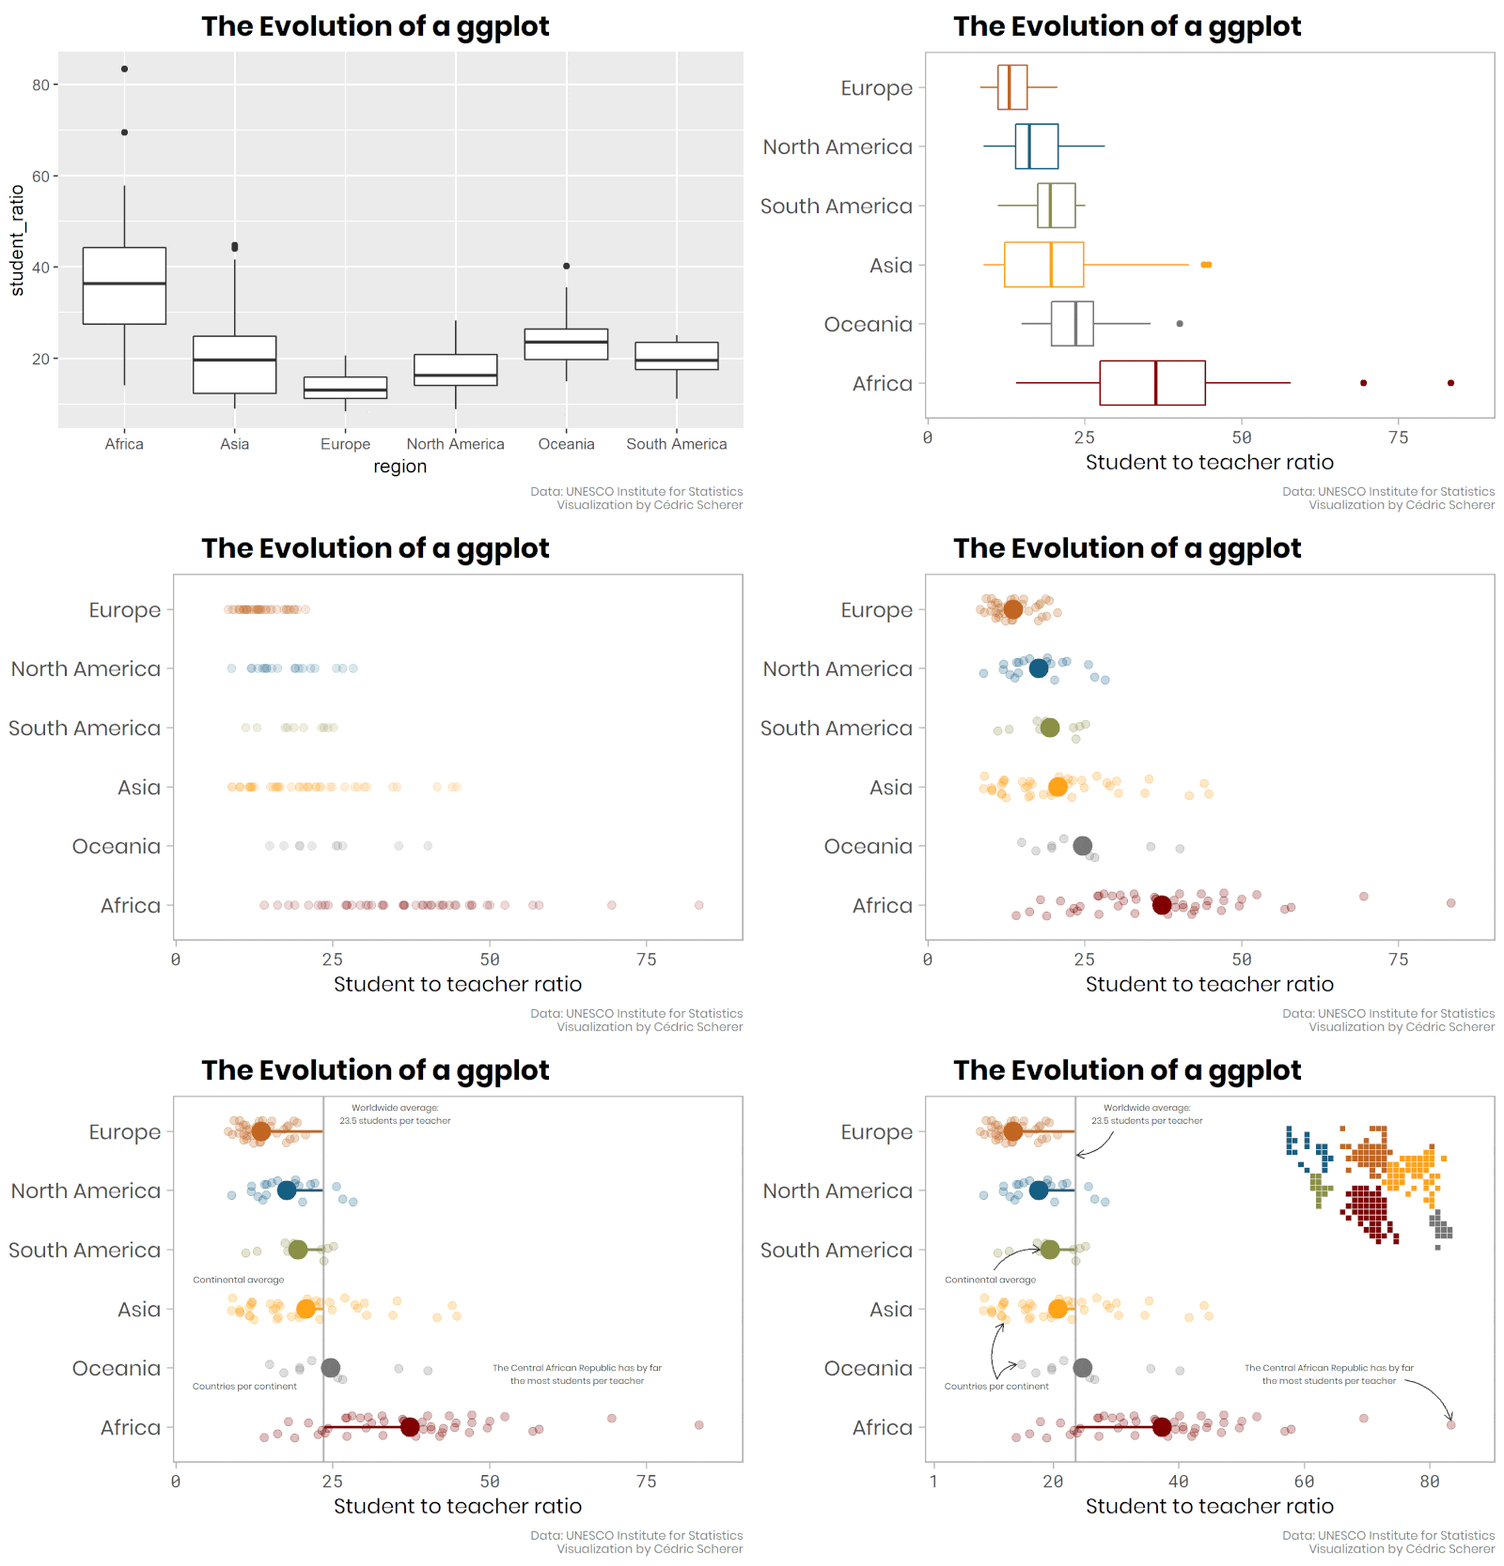
R Project Updates
Updates from R Core:
Upcoming Events in 3 Months
Events in 3 Months:
-
satRday Berlin Diversity Scholarship. Apply no later than Monday 27th May, 2019. Conference June 15th, 2019.
More past events at R conferences & meetups.
Call for Participation
Quotes of the Week
The moment I realized, my PhD mates included this huuuuuge R into my PhD hat! Just love it! They know me so well ;) #phdlife #rstats pic.twitter.com/SRVxS9a6YU
— Maja Ilić (@MajaIlicZg) 13 de maig de 2019
Question for #rstats users: what was (or is) the trickiest part for you about learning ggplot? What did you find unintuitive or hard to understand/remember? For teachers: what ggplot concepts do your students struggle with?
— Will Chase (@W_R_Chase) 13 de maig de 2019