R Weekly 2020-09 ggplot2 Tutorials, R + Docker, Finding Causation
Highlight
R in the Real World
An extremely thorough introduction into a difficult but valuable technique to learn

R in Organizations
A two-part post that I found helpful in stating clearly what nebulous data-science-esque job ads are asking for
Videos and Podcasts
Insights
Coming up to the 4th anniversary of using R, I enjoy reading about the history of the language that I did not experience. This post does this well, balancing the changes in the language itself, and the usage of R over the past 20 years since its 1.0.0 release
Most blogs on RWeekly so the development of code towards a final goal so I enjoyed this one that mostly focused on the human side of building a Shiny app. As a result, the app itself also seems extremely well designed for human users
R in Academia
New Packages
CRAN
BioC
*GitHub or Bitbucket
Updated Packages
Tutorials
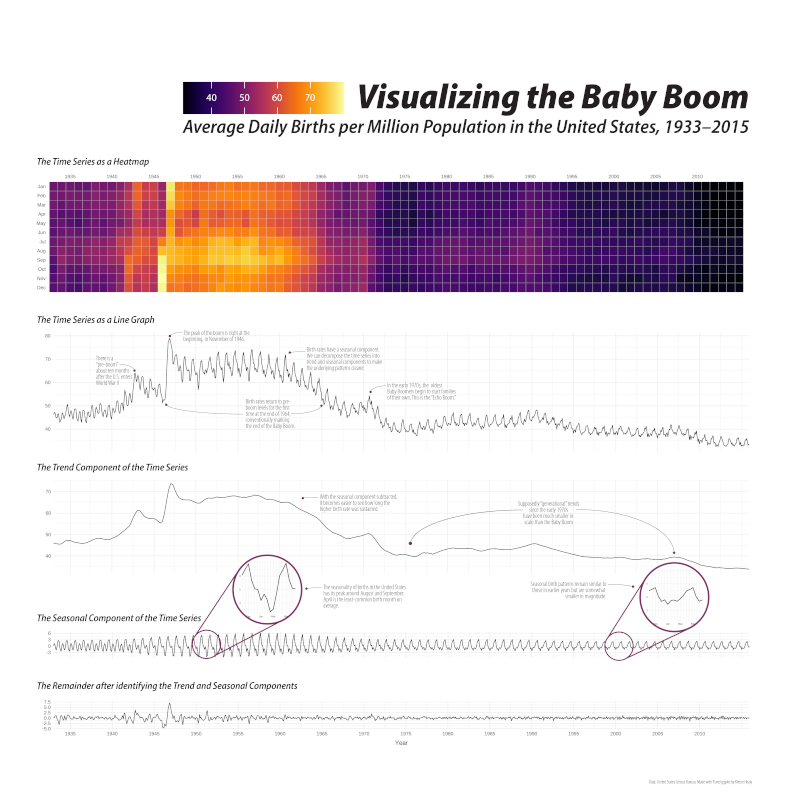
Incredibly clearly explained and visualised post on Bayesian technqieus using both brms and Stan
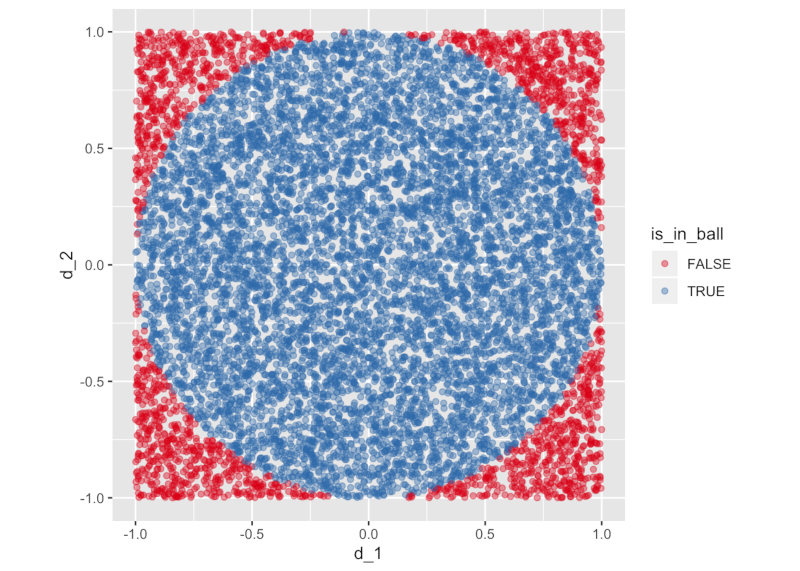
Another comprehensive guide to lesser-explained techniques, this time in understanding causal effects

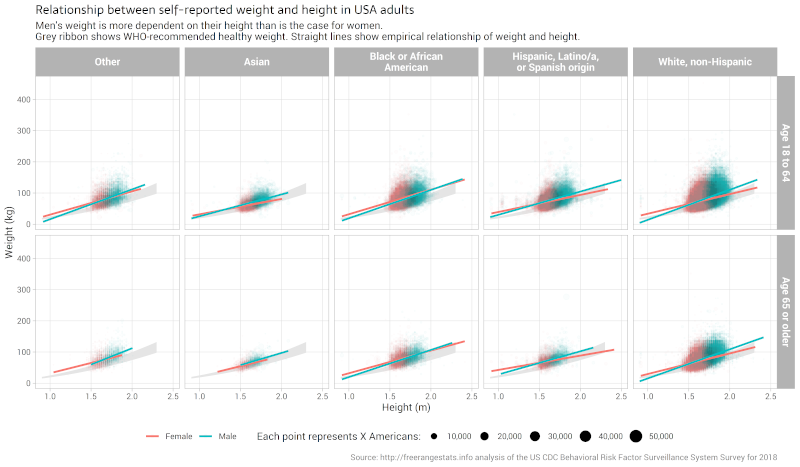
Possibly the most complete guide to geoms there is. Extremely extensive and well organised
A really neat solution especially of use to people wanting to blog about their work but limited by privacy concerns

- Take a Sad Script & Make it Better: Tidymodels Edition Really neat examples showing different approaches (and pitfalls) to the same problem coupled with a dazzling array of penguin gifs
International R
Probabilidades de pasar la fase de grupos en Copa Libertadores 2020
R Project Updates
Updates from R Core:
Upcoming Events in 3 Months
Events in 3 Months:
-
Postgres Conference 2020 - Keynote! Time-to-Event Analytics: Probabilistic Programming with R and Stan (Malmö, Sweden), March 31
-
satRday Newcastle upon Tyne, April the 4th, Call for speakers for #satRdayNCL closes 31st Jan.
More past events at R conferences & meetups.
Datasets
Jobs
Call for Participation
### Quotes of the Week
Trying to reproduce a colleague's fish movement analysis by going through his #Rstats code. his code ends with this comment.
— Peter Dudley (@BiophysicalEco) February 28, 2020
# Fuck this! I'm doing it manually pic.twitter.com/9LkWjX617I
My new map shows 554 cases of partisan bridge and rail sabotage in the Independent State of Croatia during World War II.#insurgency #resistance #sabotage #history #Yugoslavia #rstats #dataviz #maps pic.twitter.com/2EeBos5faV
— Milos Popovic (@milos_agathon) February 28, 2020
Domain specific knowledge is crucial in #dataScience, this is my new favourite picture to illustrate why! You may be an absolute #rstats or #python ninja, but be sure to team up with a domain specialist if you find yourself in unknown territory 💻📊📈📉👍 pic.twitter.com/iqu3AMIOty
— Leon Eyrich Jessen (@jessenleon) February 19, 2020
The roundest municipalities in Brazil? Useless map done entirely in R. #rstats. Using geoBr::, tnks @UrbanDemog. Inspiration @AndriyYaremenko @tjukanov. pic.twitter.com/Gr0pqi4zxV
— Arthur Welle (@ArthurWelle) February 27, 2020