R Weekly 2020-12 OncoTree, {parzer}, Flatten the Curve
Release Date: 2020-03-23
This week’s release was curated by Jon Calder, with help from the RWeekly team members and contributors.
Highlight
R in the Real World

R in Organizations
R in Academia
- When you want more than a chi-squared test, consider a measure of association for contingency tables
Resources
New Packages
CRAN
GitHub or Bitbucket
Updated Packages
Videos and Podcasts
R Internationally
Tutorials

-
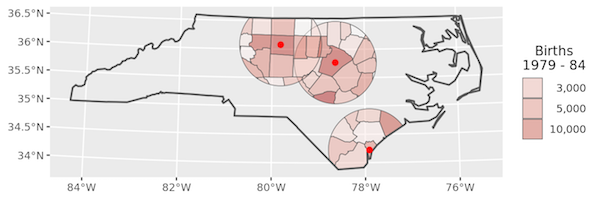
Spatial Aggregation - three approaches: based on buffers, voronoi polygons and equal distance grid cells
-
LASSO regression using tidymodels and #TidyTuesday data for The Office

-
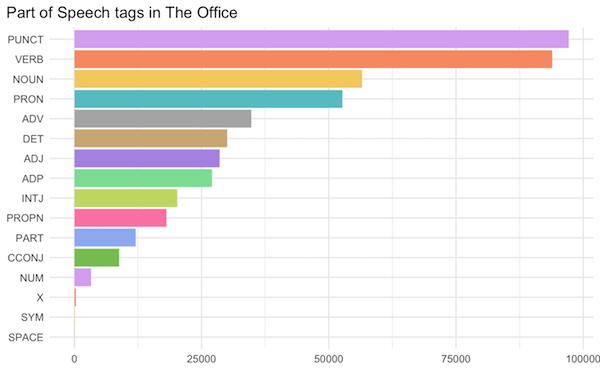
#tidytuesday: Part-of-Speech and textrecipes with The Office
-
On model specification, identification, degrees of freedom and regularization

R Project Updates
Updates from R Core:
Upcoming Events in 3 Months
Events in 3 Months:
Jobs
Call for Participation
Quotes of the Week
COVID19 acummulated cases Vs % o total cases from prior week. Datasource: John Hopkins University. Better in full screen to better grasp country codes. China is divided in two, Hubei and the rest. Full #rstats! pic.twitter.com/EBih2e1luT
— Arthur Welle (@ArthurWelle) March 17, 2020
Maybe I went too far with #ggplot2 and #gganimate ...😅
— Mickaël CANOUIL (@mickaelcanouil) March 22, 2020
What do you think @hadleywickham & @thomasp85 , did I go too far or not enough ? (I am planning to add the ghosts 😎) pic.twitter.com/nkfbti1Etd
Finally, a single correlation #rstats 📦 to rule them all?! 🙌🧮https://t.co/Cu8v7IPRvD
— Indrajeet Patil (@patilindrajeets) March 18, 2020
✅ supports ~ every correlation under 🌞:
pearson, kendall, spearman, biserial, poly/tetrachoric, biweight, distance, % bend, Shepherd's Pi
✅ handy #dataviz tools:https://t.co/GVh9HAxVMg pic.twitter.com/Y6h4l7ncU6
In the upcoming dplyr 1.0.0, summarise() expressions can return multiple rows and columns! Learn more in https://t.co/AzPkSjDwal and stay tuned for more posts on more new features. #rstats
— Hadley Wickham (@hadleywickham) March 20, 2020