R Weekly 2020-13 Faster installation, {baRcodeR}, {languageserversetup}
Release Date: 2020-03-30
This week’s release was curated by Jonathan Carroll, with help from the RWeekly team members and contributors.
Highlight
Insights
- Version Control is a Time Machine That Translates Common Hindsight Into Valuable Foresight
- Deploying RMarkdown Online
- Faster R package installation
- Le Monde puzzle [#1133]
- Le Monde puzzle [#1134]
- Collider Bias, or: Are Hot Babes Dim and Eggheads Ugly?
- rOpenSci community calls
- Data Science Courses for Economists and Epidemiologists using RTutor
- February 2020: “Top 40” New R Packages
- What would a keyboard optimised for Luxembourguish look like?
- Shiny apps with math exercises
- baRcodeR now on rOpenSci + online barcode PDF generation
- E-Learning Quizzes with R/exams for Moodle and OpenOLAT
- A deep dive into glmnet: predict.glmnet
COVID-19
- Covid 19 Tracking
- Infectious diseases and nonlinear differential equations
- How to create a simple Coronavirus dashboard specific to your country in R
- Tidying the John Hopkins Covid-19 data
- Tidying the new Johns Hopkins Covid-19 time-series datasets

- COVID-19 Data and Prediction for Michigan
- Merge Covid-19 Data with Governmental Interventions Data
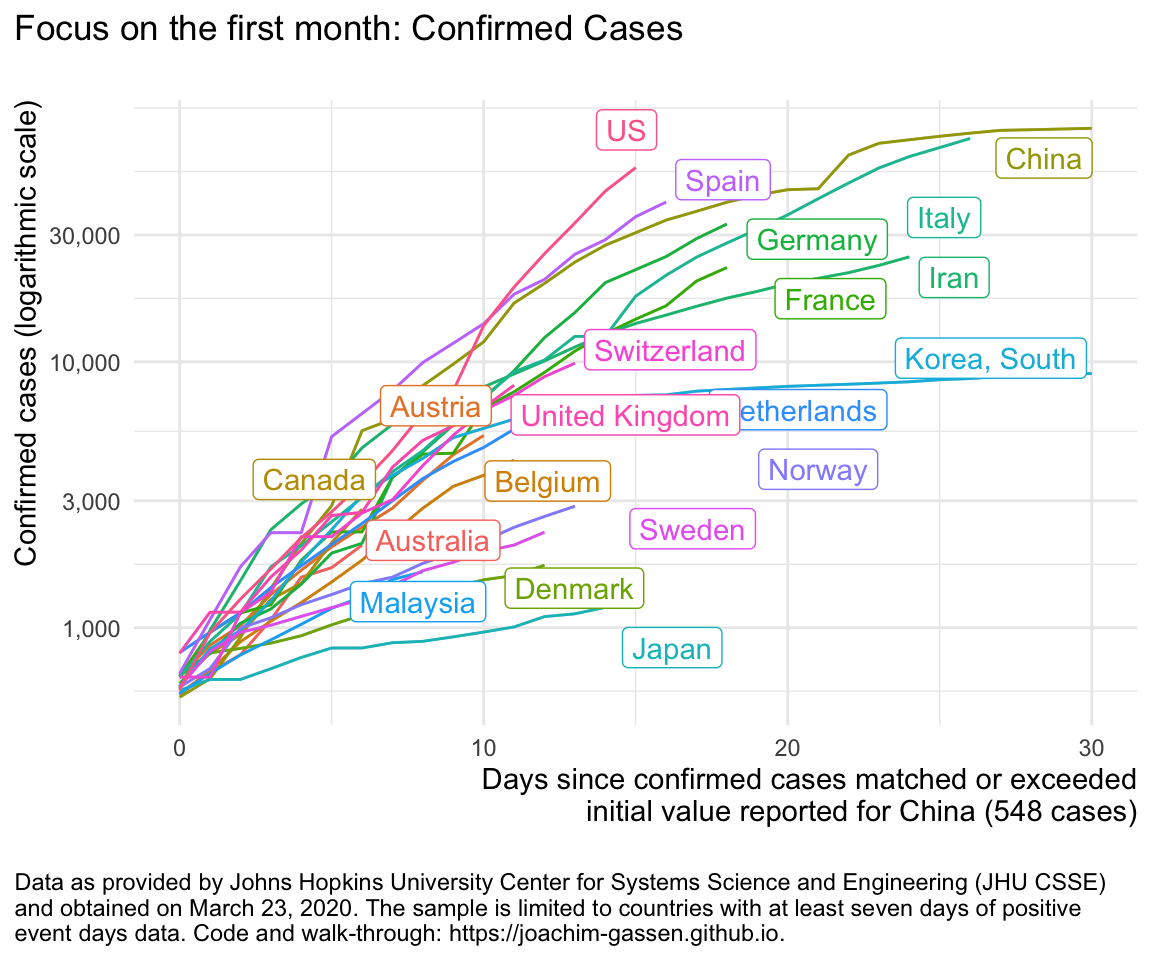
- A COVID Small Multiple
R in the Real World
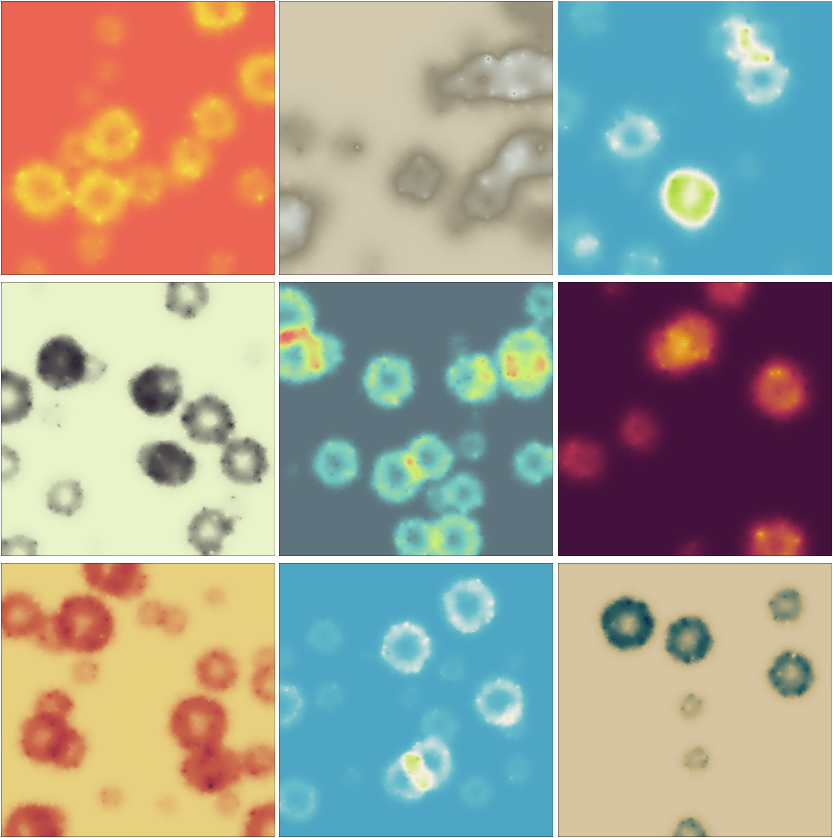
- Watercolors with the stepping stone cellular automatonhttps://fronkonstin.com/2020/03/26/watercolors/

Resources
New Packages
CRAN
- {mustashe} 0.1.1: Stash and Load Objects
- {extraterrestrial} 0.1.0: Astrobiology Equations Estimating Extraterrestrial Life
- {ggcharts} 0.1.0: Shorten the Distance from Data Visualization Idea to Actual Plot
- {deepdive} 1.0.1: Deep Learning for General Purpose
- {brio} 1.0.0: Basic R Input Output}
- {comparer} 0.2.1: Compare Output and Run Time
- {RcppDate} 0.0.1: ‘date’ C++ Header Library for Date and Time Functionality
- New package RcppDate 0.0.1 now on CRAN!
- {covid19us} 0.1.0: Cases of COVID-19 in the United States
- {Visualize.CRAN.Downloads} 1.0: Visualize Downloads from ‘CRAN’ Packages
Updated Packages
- {paws.common} 0.3.0: Paws Low-Level Amazon Web Services API
- {tidytable} 0.4.0: Tidy Interface to ‘data.table’
- {roptim} 0.1.3: General Purpose Optimization in R using C++
- {rematch2} 2.1.1: Tidy Output from Regular Expression Matching
- {gghalves} 0.1.0: Compose Half-Half Plots Using Your Favourite Geoms
- {RestRserve} 0.2.1: A Framework for Building HTTP API
- {openblender} 0.5.7: Request https://openblender.io API Services
- {neo2R} 2.1.0: Neo4j to R
- {wrapr} 2.0.0: Wrap R Tools for Debugging and Parametric Programming
- {RProtoBuf} 0.4.17: R Interface to the ‘Protocol Buffers’ ‘API’ (Version 2 or 3)
- RProtoBuf 0.4.17: Robustified
- {heatmaply} 1.1.0: Interactive Cluster Heat Maps Using ‘plotly’
- {callr} 3.4.3: Call R from R
- {adepro} 3.0.0: A ‘shiny’ Application for the (Audio-)Visualization of Adverse Event Profiles
- {parallelMap} 1.5.0: Unified Interface to Parallelization Back-Ends
- {ropenaq} 0.2.9: Accesses Air Quality Data from the Open Data Platform OpenAQ
- {GGally} 1.5.0: Extension to ‘ggplot2’
- {datetimeutils} 0.4-0: Utilities for Dates and Times
- {ipaddress} 0.2.0: Tidy IP Addresses
- {Rcan} 1.3.81: Cancer Registry Data Analysis and Visualisation}
- {hdf5r} 1.3.2: Interface to the ‘HDF5’ Binary Data Format
- {ggupset} 0.2.0: Combination Matrix Axis for ‘ggplot2’ to Create ‘UpSet’ Plots
- {drake} 7.12.0: A Pipeline Toolkit for Reproducible Computation at Scale
- {foreign} 0.8-77: Read Data Stored by ‘Minitab’, ‘S’, ‘SAS’, ‘SPSS’, ‘Stata’, ‘Systat’, ‘Weka’, ‘dBase’, …
- {sf} 0.9-0: Simple Features for R
- {mlr} 2.17.1: Machine Learning in R
- {rJava} 0.9-12: Low-Level R to Java Interface
- {chunked} 0.5.0: Chunkwise Text-File Processing for ‘dplyr’
- {mapdeck} 0.3.1: Interactive Maps Using ‘Mapbox GL JS’ and ‘Deck.gl’
- {fabletools} 0.1.3: Core Tools for Packages in the ‘fable’ Framework
- {heddlr} 0.6.0: Dynamic R Markdown Document Generation
- {DT} 0.13: A Wrapper of the JavaScript Library ‘DataTables’
- {XLConnect} 1.0.1: Excel Connector for R
Videos and Podcasts
Tutorials
- Tuning random forest hyperparameters with #TidyTuesday trees data
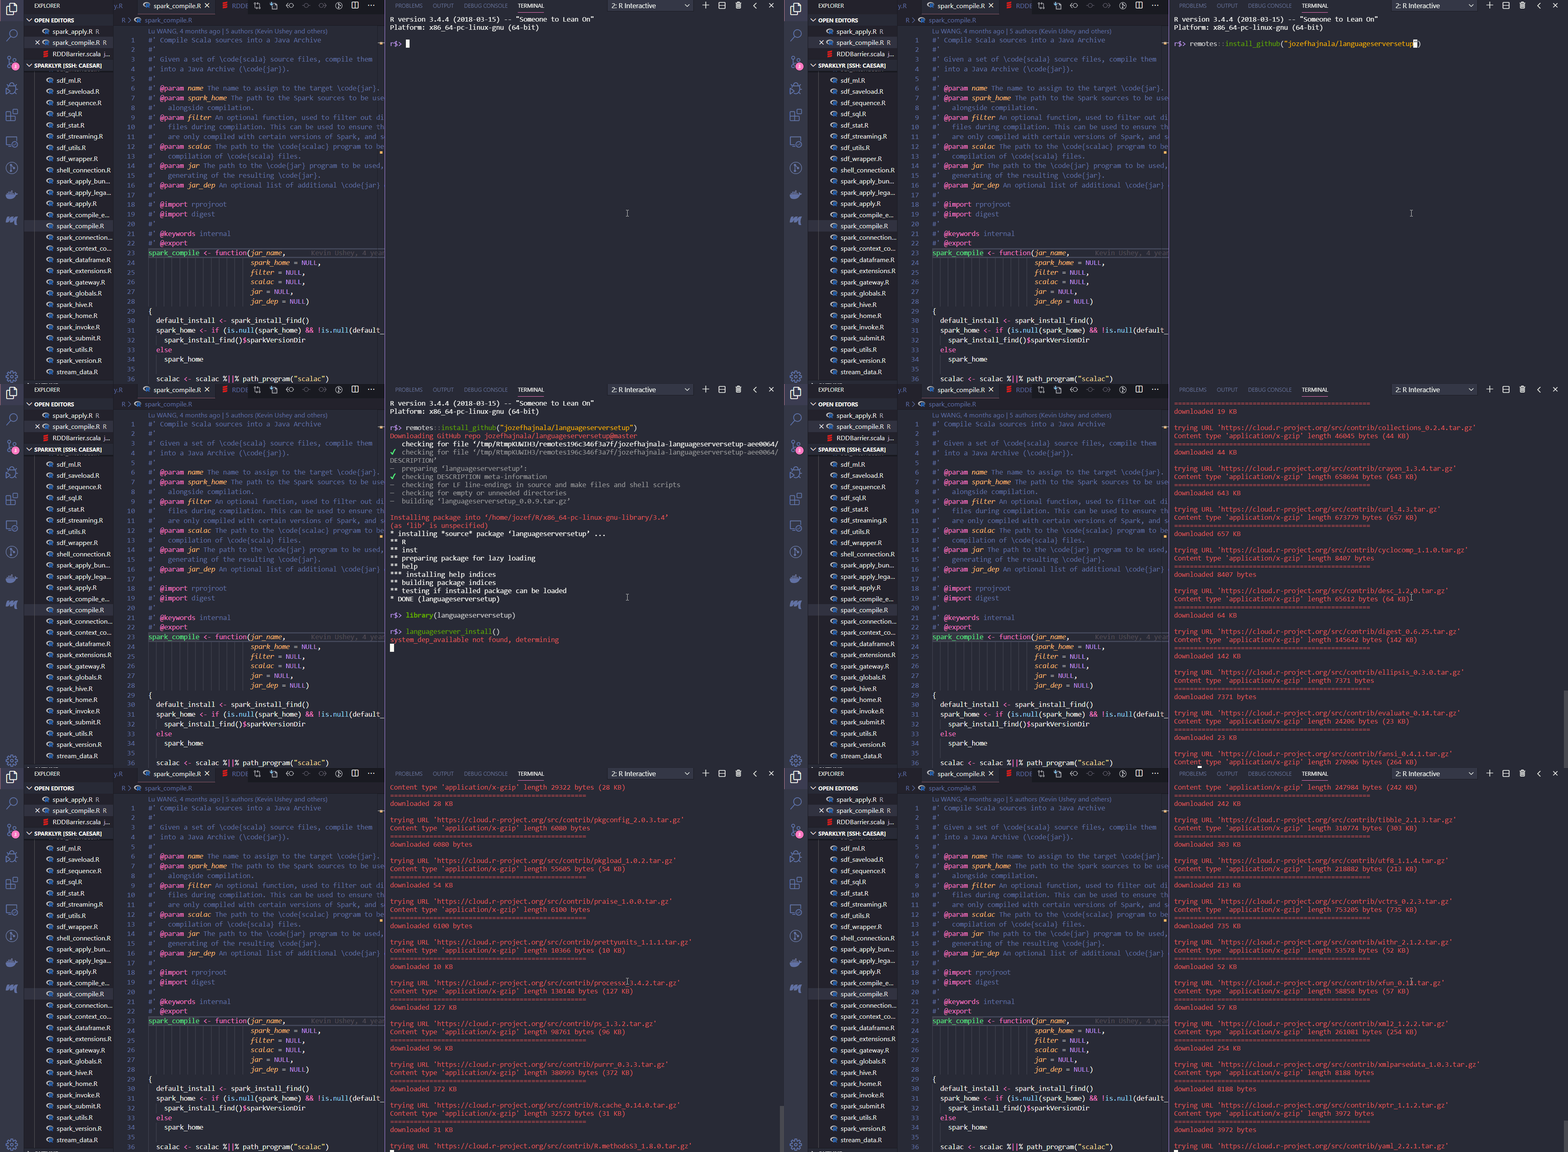
- Setting up R with Visual Studio Code quickly and easily with the languageserversetup package

- Comparing Machine Learning Algorithms for Predicting Clothing Classes: Part 4
- Time series cross-validation using crossval
- Simulating your Model Training for Robust ML Models
R Project Updates
Updates from R Core:
Upcoming Events in 3 Months
Events in 3 Months:
Call for Participation
Quotes of the Week
My first official patch to R was just accepted! 🎉 https://t.co/sbnglWLKqr
— Davis Vaughan (@dvaughan32) March 27, 2020
Finally getting around to using @dcossyle's amazing little blog post on note boxes inside markdown files [WHY was I inserting div tags manually!?!] All #rstats folks who style any of the *downs should have this article on their radar!! https://t.co/YtKcWNB4Nb pic.twitter.com/TywSL1RGr9
— Maya Gans (@Mayacelium) March 26, 2020
@thomasp85 I think, I have the whole picture now ... 🤔😎
— Mickaël CANOUIL (@mickaelcanouil) March 26, 2020
I'll share my github repository later (I still have to write a readme😅).
Enjoy #ggplot2 and #gganimate like I do ! 😉 pic.twitter.com/YBvaDGNOeG
1/3 Carve a lens out of a block of glass with #rstats and #rayrender 🔍
— Tyler Morgan-Wall (@tylermorganwall) March 27, 2020
Although I post a lot of whimsical content with rayrender, I'm legitimately excited about how it can be used to teach and demo concepts from optics. It's super easy to put this kind of stuff together in R. pic.twitter.com/LrjsekhEuI