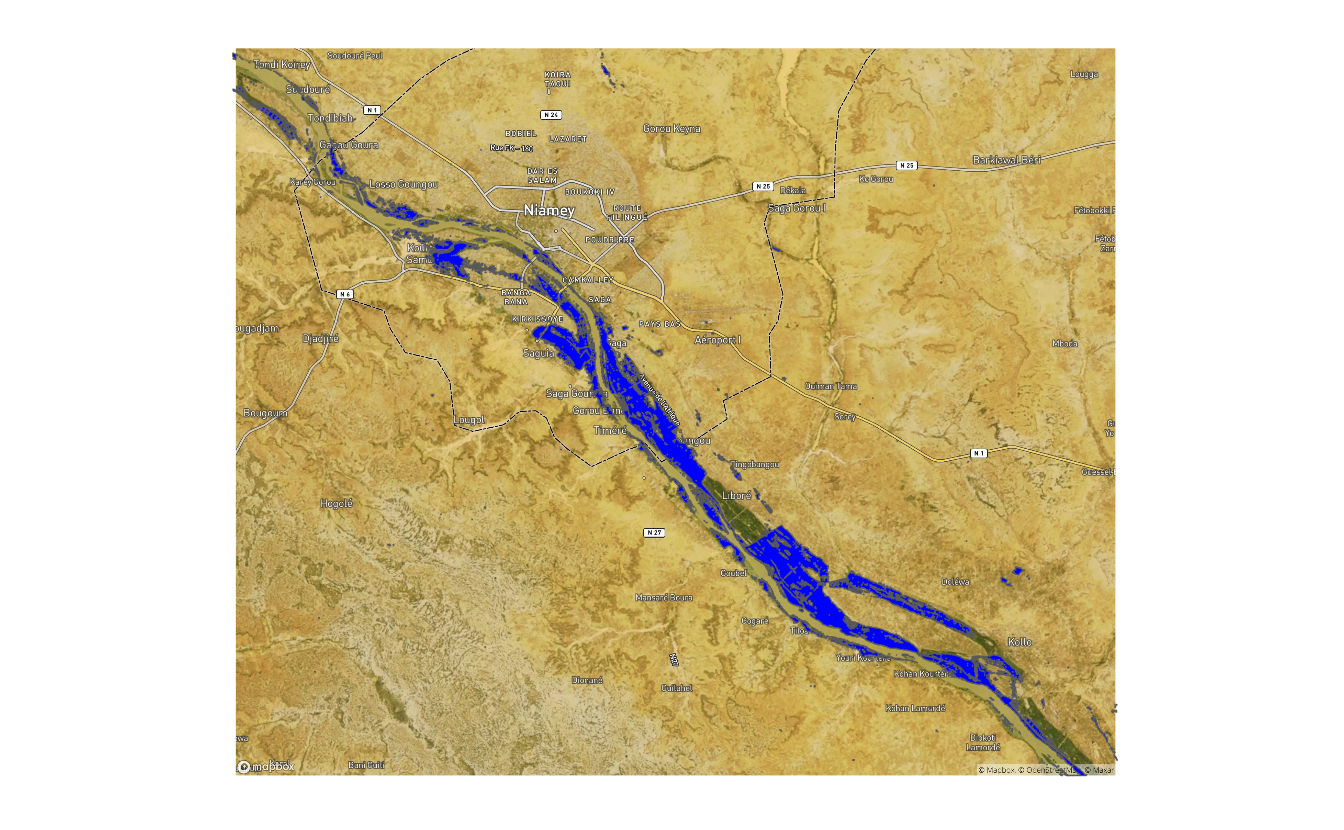
R Weekly 2020-43 Rolling averages with {slider}, mapping as art, and mapping flooding impacts.
Release Date: 2020-10-26
This week’s release was curated by Miles McBain, with help from the RWeekly team members and contributors.
Highlight
Insights
R in the Real World

Resources

New Packages
CRAN
-
{visualpred} 0.1.0: Visualization 2D of Binary Classification Models
-
{Snake} 1.0: Game of Snake
-
{MGDrivE2} 1.0.1: Mosquito Gene Drive Explorer 2
-
{hetu} 1.0.1: Structural Handling of Finnish Personal Identity Numbers
-
{flipdownr} 0.1.0: Implement a Countdown in ‘RMarkdown’ Documents and ‘shiny’ Applications
-
{APML} 0.0.1: An Approach for Machine-Learning Modelling
-
{healthfinance} 0.1.0: Financial Projections and Planning for Health Care Practices
-
{drought} 1.0: Statistical Modeling and Assessment of Drought
-
{assert} 1.0.0: Validate Function Arguments
-
{anovir} 0.1.0: Analysis of Virulence
-
{acled.api} 1.0.7: Automated Retrieval of ACLED Conflict Event Data
- {MPGE} 1.0.0: A Two-Step Approach to Testing Overall Effect of Gene-Environment Interaction for Multiple Phenotypes
-
{EnvExpInd} 0.1.0: Environmental Exposure on the Individual Level
-
{scoringTools} 0.1.0: Credit Scoring Tools
-
{deepredeff} 0.1.0: Deep Learning Prediction of Effectors
-
{labstatR} 1.0.11: Libreria Del Laboratorio Di Statistica Con R
-
{eefAnalytics} 1.0.8: Robust Analytical Methods for Evaluating Educational Interventions using Randomised Controlled Trials Designs
-
{abn} 2.3-0: Modelling Multivariate Data with Additive Bayesian Networks
-
{not} 1.2: Narrowest-Over-Threshold Change-Point Detection
-
{klsh} 0.1.0: Blocking for Record Linkage
-
{comsimitv} 0.1.4: Flexible Framework for Simulating Community Assembly
-
{BlackCarbon} 0.1.0: Processing Raw Black Carbon Concentration
-
{aceEditor} 0.1.0: The ‘Ace’ Editor as a HTML Widget
-
{wsjplot} 0.1.0: Style Time Series Plots Like the Wall Street Journal
-
{thorn} 0.1.0: ‘HTMLwidgets’ Displaying Some ‘WebGL’ Shaders
-
{smd} 0.6.6: Compute Standardized Mean Differences
-
{mbmixture} 0.2-5: Microbiome Mixture Analysis
-
{inti} 0.1.0: Tools and Statistical Procedures in Plant Science
-
{gaussplotR} 0.1.4: Predict and Plot 2D Gaussians
-
{findInFiles} 0.1.1: Find Pattern in Files
-
{bggAnalytics} 0.1.1: BoardGameGeek’s Board Game Data Analysis Tools
-
{restaurant} 0.1.0: Restaurant Data for Entity Resolution
-
{PAMmisc} 1.6.3: Miscellaneous Functions for Passive Acoustic Analysis
-
{cd} 0.1.0: CD Data for Entity Resolution
-
{biogrowth} 0.1.0: Modelling of Microbial Growth
-
{asymptor} 0.2: Estimate Asymptomatic Cases via Capture/Recapture Methods
-
{ripserr} 0.1.1: Calculate Persistent Homology with Ripser-Based Engines
-
{animint2} 2020.9.18: Animated Interactive Grammar of Graphics
-
{r5r} 0.2-0: Rapid Realistic Routing with ‘R5’
-
{singcar} 0.1.0: Comparing Single Cases to Small Samples
-
{parallelly} 1.20.0: Enhancing the ‘parallel’ Package
-
{packer} 0.0.6: An Opinionated Framework for Using ‘JavaScript’
-
{SimSurvNMarker} 0.1.1: Simulate Survival Time and Markers
-
{PortalHacienda} 0.1.5: Acceder Con R a Los Datos Del Portal De Hacienda
-
{MixSIAR} 3.1.12: Bayesian Mixing Models in R
-
{eicm} 1.0.1: Explicit Interaction Community Models
-
{YPmodel} 1.4: The Short-Term and Long-Term Hazard Ratio Model for Survival Data
-
{tablaxlsx} 1.2.4: Write Formatted Tables in Excel Workbooks
-
{semantic.dashboard} 0.1.8: Dashboard with Fomantic UI Support for Shiny
-
{nlnet} 1.4: Nonlinear Network, Clustering, and Variable Selection Based on DCOL
-
{icesTAF} 3.6.0: Functions to Support the ICES Transparent Assessment Framework
-
{i2dash} 0.2.2: Iterative and Interactive Dashboards
-
{tidycwl} 1.0.5: Tidy Common Workflow Language Tools and Workflows
-
{superpc} 1.12: Supervised Principal Components
-
{PressPurt} 1.0.2: Indeterminacy of Networks via Press Perturbations
-
{growthcurver} 0.3.1: Simple Metrics to Summarize Growth Curves
-
{trending} 0.0.1.0: Model Temporal Trends
-
{LimnoPalettes} 0.1.0: A Limnology Themed Palette Generator
-
{BET} 0.1.0: Binary Expansion Testing
-
{keys} 0.1.0: Keyboard Shortcuts for ‘shiny’
- {rock} 0.1.1: Reproducible Open Coding Kit
BioC
GitHub or Bitbucket
Updated Packages
-
{simstudy}: Illuminating research methods through data generation
Videos and Podcasts
-
ConTESSA: A Shiny App to Help Quantify Contact Tracing Efficacy (Presentation)
-
Video + code from workshop on Deep Learning with Keras and TensorFlow
Shiny Apps
-
ConTESSA: A Shiny App to Help Quantify Contact Tracing Efficacy
-
dinnR: Help you plan a week of grocery for your vegan dinners
R Internationally
Tutorials


R Project Updates
Updates from R Core:
Upcoming Events in 3 Months
Events in 3 Months:
Call for Participation
Quotes of the Week
The #Jaguar has lost at least 20% of its home range in #Pantanal biome, which has been burned more and more. The animation below was made using #moveVis and shows some Jaguars moving in an area which was burned a lot this year. That's sad! pic.twitter.com/0QT9D8AHN9
— We are R-Ladies (@WeAreRLadies) October 22, 2020
My girlfriend baked an #rstats cake for my birthday and it's like the best 👌😍👍 pic.twitter.com/skSfwsQYTm
— Fabio Votta📊🦉 (@favstats) October 23, 2020
Today's #rstats FYI: function overwrite only happens the first time you load a package
— Lisa DeBruine 🏳️🌈 (@LisaDeBruine) October 20, 2020
select(sleep, ID) # select not found
library(dplyr)
select(sleep, ID) # OK now
library(MASS)
select(sleep, ID) # error
library(dplyr)
select(sleep, ID) # still error