R Weekly 2021-W29 Simulation-based science, custom fonts, wrapping errors
Release Date: 2021-07-20
This week’s release was curated by Jonathan Carroll, with help from the RWeekly team members and contributors.
Highlight
Insights
- Simulation-based Science: Breaking Boundaries
- COUNTIF Function in R
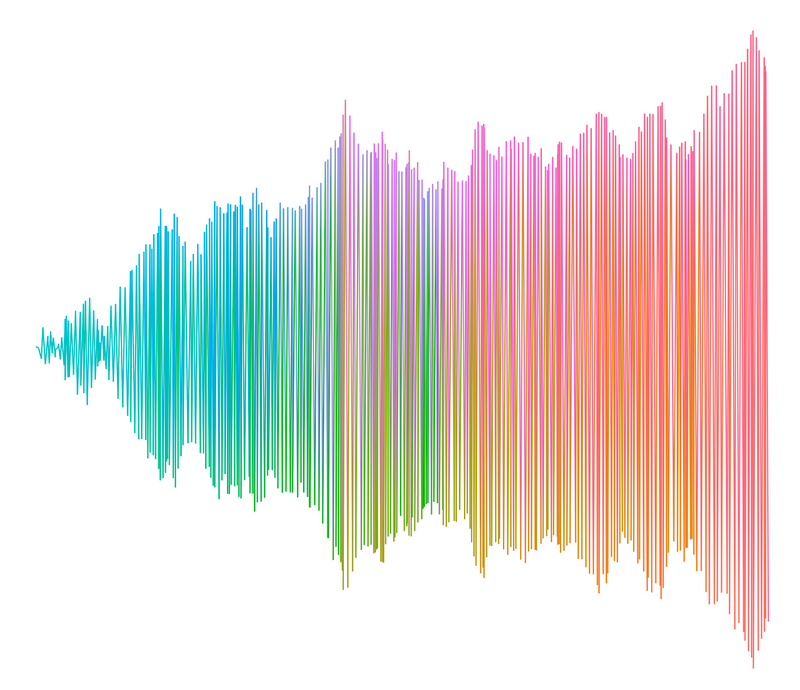
- Little useless-useful R functions – Colourful ggplot line graphs

- Multinomial but unique
- Introducing {ingrid} - alternate tools for grab creation, manipulation and output
- R Consortium Diversity & Inclusion – Speaker Nomination
- Introducing ‘sars’ - proof-of-concept for running ‘SAS’ DATA and PROC SQL statements in R
- Cleaning up forked GitHub repositories with {gh}
- Predict which #TidyTuesday Scooby Doo monsters are REAL with a tuned decision tree model
- Make error messages your own
- Visualizing topic models with crosstalk
- How to become a better R code detective?
- New package katex: rendering math to HTML and MathML in R
- {gitShiny}: Creating a Shiny app as a tool for Learning Git
- Little useless-useful R functions – Is it raining yet?
- Euler Coding Challenge: Build Maths’ Most Beautiful Formula in R
- Shiny, Tableau, and PowerBI: Better Business Intelligence
- UseR2021: Integrating R into Production
- GooglyPlusPlus2021 adds new bells and whistles!!
- Do email templates reduce my workload?
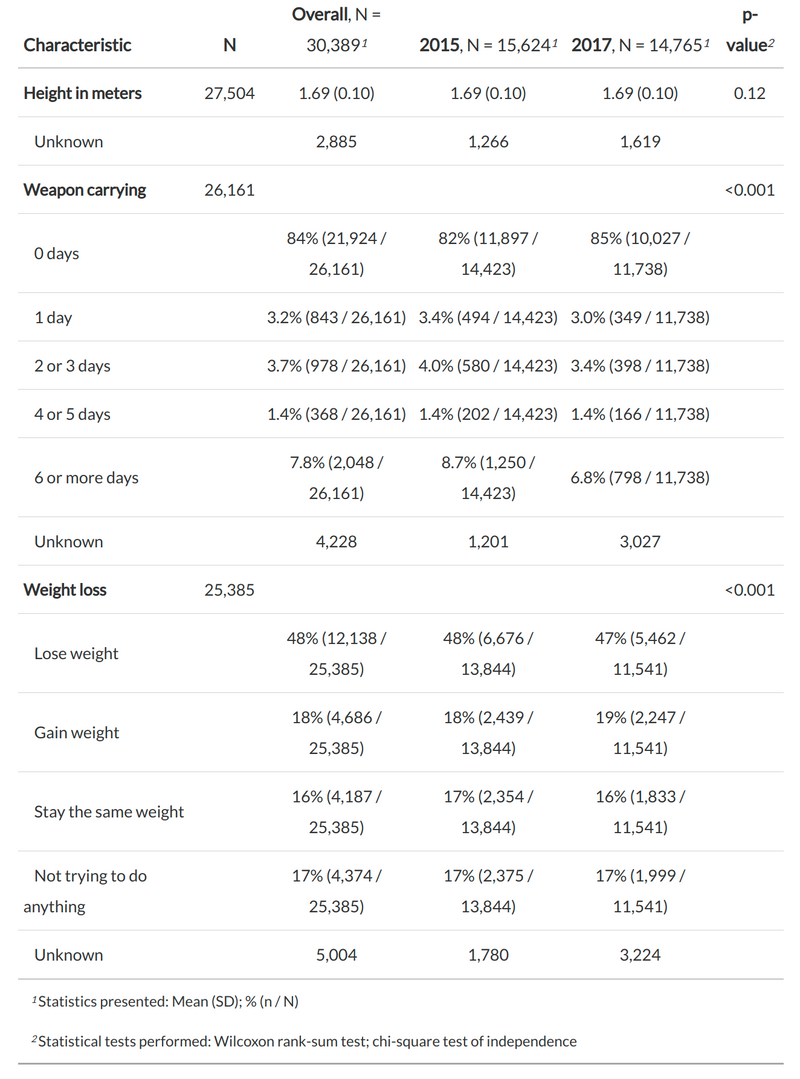
- Polished summary tables in R with gtsummary

R in Organizations
New Packages
CRAN
- {RstoxData} 1.2.1: Tools to Read and Manipulate Fisheries Data
- {tsentiment} 0.1.0: Fetching Tweet Data for Sentiment Analysis
- {shinyToastify} 1.0.0: Pretty Notifications for ‘Shiny’
- {rbedrock} 0.1.0: Analysis and Manipulation of Data from Minecraft Bedrock Edition
- {tRnslate} 0.0.3: Translate R Code in Source Files
- {starter} 0.1.4: Starter Kit for New Projects
- {rstudio.prefs} 0.1.4: Set ‘RStudio’ Preferences
- {mcglm} 0.7.0: Multivariate Covariance Generalized Linear Models
Updated Packages
- {ttdo} 0.0.7: Micro-tweak
- {RcppArmadillo} 0.10.6.0.0: A New Upstream
- {FSA} 0.9.1: Simple Fisheries Stock Assessment Methods
- {cli} 3.0.1: Helpers for Developing Command Line Interfaces
- {dotwhisker} 0.7.0: Dot-and-Whisker Plots of Regression Results
- {fishmethods} 1.11-2: Fishery Science Methods and Models
- {yum} 0.1.0: Utilities to Extract and Process ‘YAML’ Fragments
- {bs4Dash} 2.0.1: A ‘Bootstrap 4’ Version of ‘shinydashboard’
- {shinydashboardPlus} 2.0.2: Add More ‘AdminLTE2’ Components to ‘shinydashboard’
- {stringi} 1.7.3: Character String Processing Facilities
- {grattan} 1.9.0.9: Australian Tax Policy Analysis
- {do} 1.9.0.0: Data Operator
- {ausplotsR} 1.2.6: TERN AusPlots Analysis Package
- {sever} 0.0.7: Customise ‘Shiny’ Disconnected Screens and Error Messages
- {readtext} 0.81: Import and Handling for Plain and Formatted Text Files
- {ranger} 0.13.1: A Fast Implementation of Random Forests
- {vroom} 1.5.3: Read and Write Rectangular Text Data Quickly
- {rtables} 0.3.8: Reporting Tables
- {csv} 0.6.1: Read and Write CSV Files with Selected Conventions
- {BayesTools} 0.1.1: Tools for Bayesian Analyses
- {styler} 1.5.1: Non-Invasive Pretty Printing of R Code
Videos and Podcasts
R Internationally
Tutorials
R Project Updates
Updates from R Core:
Upcoming Events in 3 Months
Events in 3 Months:
Call for Participation
Quotes of the Week
HUH! Just found out that … works in R's lambda notation
— Mikhail Popov (@bearloga) July 19, 2021
f <- \(...) paste(..., sep=", ")
> f("apples", "oranges", "bananas")
[1] "apples, oranges, bananas"
I don't know why this was so surprising to me.
📦🧪 For the past few days I've been working on an analogy to teach @hadleywickham and @_lionelhenry's {rlang} package for #RStats students. How did I do? ... pic.twitter.com/2UQMU5QktD
— C. Lente (@clente_) July 19, 2021
If you love plots produced by {easystats} 📦s, you should check out the {see} 📦, which is the power house that produces these plots! 👨🏭 https://t.co/iOIFxuxr88
— easystats (@easystats4u) July 18, 2021
It also has probably one of the richest collections of statistical visualizations in #rstats! 📊#dataviz #phdchat pic.twitter.com/fNWDG44IEG