R Weekly 2023-W23 gptstudio, Web Scraping with R
This week’s release was curated by Jon Calder, with help from the R Weekly team members and contributors.
Highlight
Insights
R in the Real World
R in Organizations
R in Academia
Resources
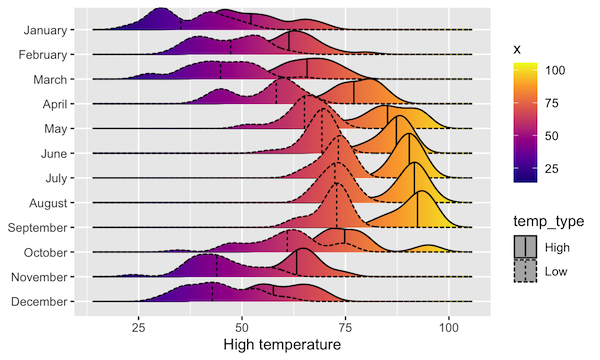
- Data Visualization with R: Use R, ggplot2, and the principles of graphic design to create beautiful and truthful visualizations of data

New Packages
CRAN
-
{mirai.promises} 0.1.0: use ‘mirai’ as ‘promises’ for easy integration in ‘plumber’ or ‘shiny’ pipelines.
-
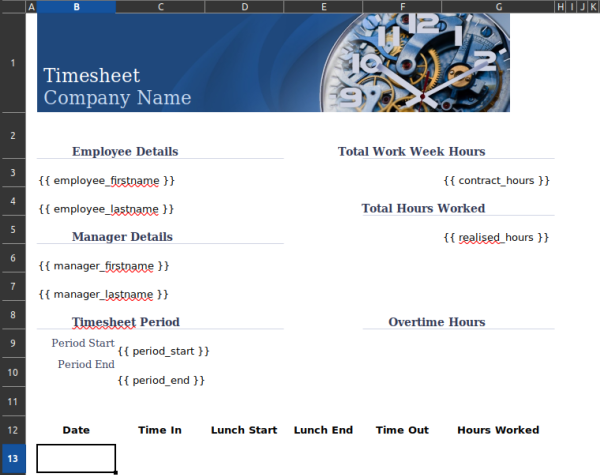
xlcutter 0.1.0: Parse Batches of ‘xlsx’ Files Based on a Template

- {glossary 1.0.0}: Add glossaries to markdown and quarto documents by tagging individual words. Definitions can be provided inline or in a separate file
Updated Packages
-
{nanonext} 0.9.0: R binding for NNG (Nanomsg Next Gen) Lightweight Messaging Library
-
{NIMBLE} 1.0.0: A system for building and sharing analysis methods for statistical models, especially for hierarchical models and computationally-intensive methods (such as MCMC and SMC)
-
{attachment} 0.4.0: Breaking changes and configuration file for a better experience
-
{countrycode} 1.5.0: Standardize country names, convert them into one of 40 different coding schemes, convert between coding schemes, and assign region descriptors
Videos and Podcasts
R Internationally
Tutorials
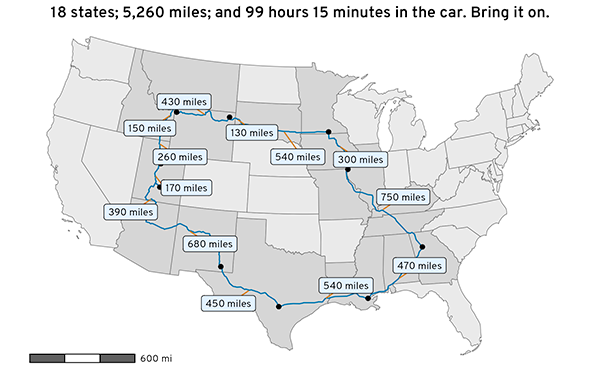
- How to make fancy road trip maps with R and OpenStreetMap: Use R to get geocoded location and routing data from OpenStreetMap and explore a 5,000 mile road trip around the USA

-
Making a Simple Package in R using Modern Tools: a quick guide on how to build a package very quickly (with dependencies) using devtools, usethis, and roxygen2.

R Project Updates
Updates from R Core:
R Contributor Office Hours, Thursday June 8: Europe/Middle East/Asia-Pacific Hour or Americas Hour
Join an online Office Hour at the time that suits you to:
- discuss how to get started contributing to R
- get help/feedback on contributions you are working on
- look at open bugs/work on translations together
Upcoming Events in 3 Months
Events in 3 Months:
-
Access and Analyze the New 2020 Decennial Census Data - June 15th, 2023
-
Mapping and Spatial Analysis with the 2020 Decennial Census - June 22th, 2023
-
Building reproducible analytical pipelines in R workshop - June 29th, 18:00-20:00 CEST
Jobs
💼 Explore Jobs & Gigs Board on RStudio Community 💼
rtistry
In the world of #dataviz sometimes art meets science! 🖌👩🔬
— Atlas of Living Aust (@atlaslivingaust) May 31, 2023
We plotted parrot data in the ALA to celebrate #WorldParrotDay 🦜 using the dominant plumage shades for each genus 🌈 and created some accidental art in the process!
Watch out Monet 🎨 @accidental_aRt#rstats #Rtistry pic.twitter.com/Bbxzv87L1A
My new map shows the % people who never accessed the Internet in 2022 😱😱😱#RStats #DataScience #dataviz #maps #gischat #digital #Internet pic.twitter.com/VKS6jGD3mS
— Milos Popovic (@milos_agathon) May 31, 2023
A #dataviz about the distribution of farm animals in France#Rstats code: https://t.co/t8RszXllYU pic.twitter.com/UFwujzbVB1
— Benjamin Nowak (@BjnNowak) June 2, 2023
Quotes of the Week
I'm building a #Rstats #ShinyApp to visualize the spatial distribution of sea otter foraging observations (black dots) and kelp canopy (heatmap) cover along the Monterey Peninsula. This #dataviz integrates published Landsat data with on-the-ground otter foraging observations. pic.twitter.com/ZLgvFIvHf4
— Joshua G. Smith (@Smith_JoshuaG) June 2, 2023