R Weekly 2023-W24 R idioms, bslib, donut plots
This week’s release was curated by Tony ElHabr, with help from the R Weekly team members and contributors.
Highlight
Insights
R in the Real World
R in Organizations
-
Using R in Production with Posit Connect: Deploying Models as APIs for Customer-Facing Applications
-
Bridging Ecology, Statistics, and Data Science with R for Biodiversity and Climate Change Research
-
JAGS Simulation with Multivariate State-Space Model: The G7 on Food Security
Resources
New Packages
CRAN
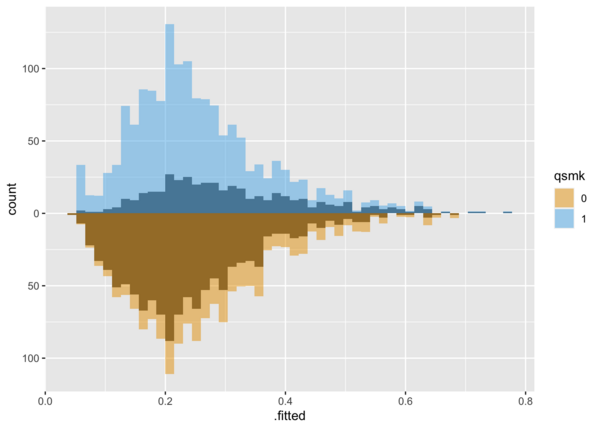
- {halfmoon} 0.1.0: Techniques to Build Better Balance (causal inference)
-
{cereal} 0.1.0: Serialize ‘vctrs’ Objects to ‘JSON’
-
{texor} 1.0.1: Converting ‘LaTeX’ ‘R Journal’ Articles into ‘RJ-web-articles’
-
{glmnetr} 0.2-1: Nested Cross Validation for the Relaxed Lasso and Other Machine Learning Models
-
{gptzeror} 0.0.1: Identify Text Written by Large Language Models using ‘GPTZero’
GitHub or Bitbucket
- {pyblack} 0.1.0: RStudio addin to style Python code blocks with black
Updated Packages
-
{vetiver} 0.2.1: Version, Share, Deploy, and Monitor Models - diffify
-
{reticulate} 1.29: Interface to ‘Python’ - diffify
-
{torch} 0.11.0: Tensors and Neural Networks with ‘GPU’ Acceleration - diffify
-
{survstan} 0.0.2: Fitting Survival Regression Models via ‘Stan’ - diffify
Videos and Podcasts
Gist & Cookbook
Tutorials
R Project Updates
Updates from R Core:
Upcoming Events in 3 Months
Events in 3 Months:
-
Access and Analyze the New 2020 Decennial Census Data - June 15, 2023
-
Mapping and Spatial Analysis with the 2020 Decennial Census - June 22, 2023
-
Building reproducible analytical pipelines in R workshop - June 29, 2023
-
‘Advanced Shiny Development’ the hands-on workshop - June 21, 2023
Jobs
💼 Explore Jobs & Gigs Board on RStudio Community 💼
rtistry
Streets of New York City in current wildfire colors. #rstats pic.twitter.com/J4h51GExZP
— Ansgar Wolsing | @[email protected] (@_ansgar) June 8, 2023
More generative art in #RStats 🎨#GenArtClub #Rtistry #GenerativeArt pic.twitter.com/YxbOeAd5Sm
— Nicola Rennie | @[email protected] (@nrennie35) June 11, 2023
Share of electricity generation in Europe for this week's #TidyTuesday
— Georgios Karamanis (@geokaramanis) June 11, 2023
code: https://t.co/me634LCOfU#RStats #dataviz pic.twitter.com/Bt7cRkEque
Quotes of the Week
Sometimes people ask me if I can do one-on-one R tutoring.
— Albert Rapp (@rappa753) June 7, 2023
Sure I can. But then my hourly rate applies. And there are many amazing *free* resources. Want to try them first?
Here are a few that I recommend. #rstats
Just watched an insightful talk on "7 essential Excel data visualization tips (in R!)" by @ivelasq3. Inspired by the learnings, I created my own graph using ggpattern.
— Deepali Kank (@DeepaliKank) June 10, 2023
Code: https://t.co/IQpjRm4kEp#RStats #dataviz pic.twitter.com/3x3E5KQNFI