R Weekly 2026-W28 Testing plumber APIs, watcher
This week’s release was curated by Jon Calder, with help from the R Weekly team members and contributors.
Highlight
- Testing Your Plumber APIs from R
- watcher 0.2.0: filesystem watching for R, and the engine behind Shiny auto-reload
Insights
- rOpenSci News Digest, June 2026
- posit::glimpse() Newsletter – July 2026
- May 2026 Top 40 New CRAN Packages
- Test Driving Claude Science
R in the Real World
- Long term economic growth rates by @ellis2013nz
- Machine learning meets reality: Forecast evaluation for the 2026 FIFA World Cup
- Rethinking Validation for Spatial Machine Learning: Takeaways from the Talk
- Understanding Tail Analysis in Financial Markets
Tutorials
- Working with non-tabular files
- Testing Your Plumber APIs from R
- watcher 0.2.0: filesystem watching for R, and the engine behind Shiny auto-reload
Resources
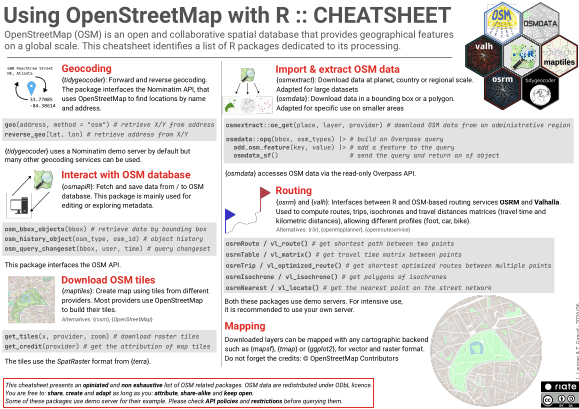
New Packages
📦 Keep up to date wtih CRANberries 📦
CRAN
- {apifetch} 0.1.0: Token-Authenticated REST API Retrieval Toolkit
- {amorem} 1.0.0: Augmented Modelling of Relational Events
- {araponga} 1.0.1: Estimate 3D Orientations from 2D Landmarks
- {AutoStrataK} 0.1.4: Automatic Optimal Stratification for Survey Sampling
- {axprism} 0.2.0: Client for the ‘AxPrism’ Institutional XBRL and Shariah Compliance API
- {baselinr} 0.5.0: WWC-Aligned Baseline Equivalence Tables for Education Impact Evaluations
- {BioTooltipR} 0.1.0: Add Bio Tooltips to HTML Reports
- {bitriad} 0.4: Triadic Analysis of Affiliation Networks
- {canpumf} 0.5.2: Parse StatCan PUMF Files
- {caretMultimodal} 1.0.0: Multimodal Late Fusion with ‘caret’
- {CbKST} 0.1-0: Competence-Based Knowledge Space Theory
- {checktor} 0.1.0: Extra CRAN Submission Checks
- {clim4health} 0.1.0: Post-Processing of Climate Data for Health Applications
- {clusterIV} 0.1.0: Clustered Jackknife Instrumental Variables Estimation
- {cp1919} 0.1: Radio Observations of the Pulse Profiles and Dispersion Measures of Twelve Pulsars
- {crawlee} 0.1.0: Tidy Interface for Reproducible Web Crawling
- {cyclicwave} 0.1.0: Cyclic Wave Analysis for Time-Series Clustering
- {DAST} 0.1.0: Spatio-Temporal Disaggregation for Maps with Changing Areal Boundaries
- {deaviz} 0.1.0: Visualization of Data Envelopment Analysis Problems
- {delarr} 0.1.0: Lazy Delayed Arrays with Fused Execution
- {dicepro} 1.0.2: Semi-Supervised Deconvolution of Bulk RNA-Seq Data with Hyperparameter Optimization
- {droughtevents} 0.1.0: Identify and Characterize Drought Events from Drought Index Time Series
- {DSGEr} 1.3.1: Transcriptional Disruption Score for Gene Sets
- {ecpromethee} 0.1.0: EC-PROMETHEE Multi-Criteria Decision Method
- {emaxnls} 0.1.1: Nonlinear Least Squares Estimation for Emax Regression Models
- {ernest} 1.2.4: A Toolkit for Nested Sampling
- {evbsreg} 1.0.0: Local Influence Diagnostics for the Extreme-Value Birnbaum-Saunders Regression Model
- {fibr} 0.1.1: Prior-Fraction Diagnostics for Hierarchical Models
- {fixedCV} 0.1.0: Fixed-b Critical Values for Robust Inference with Time Series
- {fz} 1.1: R Wrapper for the ‘funz-fz’ Parametric Simulation Framework
- {GMLTM} 0.1.0: Generalized Multicomponent Latent Trait Model for Diagnosis
- {gp3tools} 1.0.2: Import, Inspect, Analyse, and Report Gazepoint GP3 Exports
- {GSbench} 0.1.0: Benchmarking Genomic Selection and Machine-Learning Prediction Models
- {HomeRangeR} 0.1.0: Predict Vertebrate Home-Range Sizes Using Allometric Models
- {hubEvals} 0.3.0: Tools for Scoring and Evaluating Hubverse Model Outputs
- {huggingfaceR} 2.1.0: Access ‘Hugging Face’ Models and Datasets
- {HVS} 1.0.0: Hypergraph Variable Selection
- {icarm} 0.1.0: Interpretable Contextual-Accountable and Responsible Machine Learning
- {ImprintCapASM} 0.1.1: Allele-Specific Methylation Analysis for Imprinted DMR Diagnostics
- {jpmap} 0.1.3: Japan Maps with Insets for Okinawa and Ogasawara
- {lt} 0.1: Lightweight Tables via JSON Specs and JavaScript
- {lvmPlot} 0.1.0: Publication-Quality Diagrams for Latent Variable Models
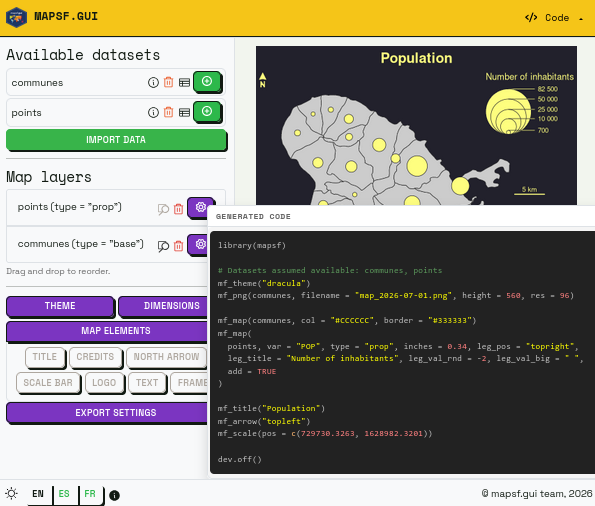
- {mapsf.gui} 0.1.0: Create Thematic Maps Interactively
- {mergersim} 0.1.0: Merger Simulation and Calibration
- {mixedsubjects} 1.0.0: Causal Inference in Experiments with Mixed-Subjects Designs
- {msPCA} 0.5.0 Introducing msPCA: a new package for sparse PCA with multiple components
- {MultiModalR} 1.0.0: Fast Bayesian Probability Estimation for Multimodal Categorical
- {muse} 0.1.0: Multiple Unobserved Sources of Error State Space Models
- {NeighborFinder} 1.0.1: Find Neighbor Species of a Bacteria of Interest in the Human Gut Microbiota
- {netify} 1.5.3: Tools for Network Data Workflows
- {OptSurvCutR} 0.10.0: Optimal Survival Cut-Point Discovery for Time-to-Event Analysis
- {palsr} 0.1.0: Projected Actor Locations for Spatial Interaction Modeling
- {panelbuild} 0.1.0: Panel Data Auditing, Validation, and Preparation Tools
- {peeky} 0.1.0: Download and Extract ‘shinylive’ Applications
- {PITS} 0.1.0: Power of Interrupted Time Series (ITS) Studies
- {porter} 0.1.0: Generate Port Files for C Libraries
- {proximetricsR} 0.6.4: Spectral Preprocessing and Chemometric Calibration of NIR Sensors
- {PsychoMatic} 0.3.0: Automated Psychometric Workflows and Reporting Tools
- {R2camtrapdp} 2.0.0: Convert Camera Trap Dataset to ‘Camtrap DP’
- {rfair} 0.1.0: Assess the FAIRness of Research Data Objects and Software
- {rtransparency} 1.0.0: Identifies Indicators of Transparency
- {saeHB.Spatial.Beta} 0.1.0: Small Area Estimation Hierarchical Bayes for Spatial Beta Model
- {SDALGCP2} 0.1.0: Fast Spatially Discrete Approximation to Log-Gaussian Cox Processes for Aggregated Disease Count Data
- {seqcomp} 0.1.0: Sequential Comparison of Probabilistic Forecasts
- {shinyReports} 1.0.3: R Markdown HTML Tab Rendering for Shiny
- {SimplexRegression} 0.1.3: Simplex Regression Models with Parametric or Fixed Mean Link Functions
- {sportsfeatures} 0.1.0: Longitudinal Sports Analytics Asset and Workload Feature Processing
- {steves} 0.1.1: Rick Steves’ Europe Episodes for Teaching Data Analysis
- {svmodt} 0.1.0: Linear SVM-Based Recursive Decision Trees
- {taxify} 0.2.12: Offline Taxonomic Name Matching Against Local Darwin Core Snapshots
- {TestREnlme} 0.1.0: Nonparametric Tests for Random Effects in Linear and Nonlinear Mixed-Effects Models
- {testflow} 0.8.2: A Workflow for Statistical Testing, Interpretation, and ‘ggplot2’-Based Visualization
- {trackclean} 0.1.0: Tools for Cleaning High-Frequency Real-Time Location Tracking Data
- {uddbart} 0.2.0: Unified Dynamic Deep ‘BART’ for Interval-Censored Survival
- {UKBAnalytica} 1.0.0: UK Biobank Data Processing and Survival Analysis Toolkit
- {vbm} 0.1.0: Variance-Based Sensitivity Analysis for Weighting Estimators
- {weightflow} 0.1.0: Declarative API for Staged Survey Weights
- {wompwomp} 0.99.0: Optimizing Alluvial Plots
Updated Packages
- {rstatix} 1.0.0: Pipe-Friendly Framework for Basic Statistical Tests - diffify
- {neonSoilFlux} 4.0.1: Compute Soil Carbon Fluxes for the National Ecological Observatory Network Sites - diffify
- {FinePop2} 0.6: Fine-Scale Population Analysis (Rewrite for Gene-Trait-Environment Interaction Analysis) - diffify
- {COVID19} 3.0.4: R Interface to COVID-19 Data Hub - diffify
- {optedr} 3.0.1: Calculating Optimal and D-Augmented Designs for Single- and Multi-Factor Models - diffify
- {GenericML} 0.2.3: Generic Machine Learning Inference - diffify
- {munsellinterpol} 3.4-0: Interpolate Munsell Renotation Data from Hue Value/Chroma to CIE/RGB - diffify
- {explor} 0.3.11: Interactive Interfaces for Results Exploration - diffify
- {CBTF} 0.7.0: Caught by the Fuzz! - A Minimalistic Fuzz-Test Runner - diffify
- {splitGraph} 0.3.0: Dataset Dependency Graphs for Leakage-Aware Evaluation - diffify
- {bacenR} 0.4.4: Access Data from Brazilian Central Bank: IFdata, Active Institutions, Balance Sheets and Normative Acts - diffify
- {actuaRE} 1.0.1: Handling Single-Level and Hierarchically Structured Risk Factors using Credibility and Random Effects Models - diffify
- {hsphase} 3.0.1: Phasing, Pedigree Reconstruction, Sire Imputation and Recombination Events Identification of Half-sib Families Using SNP Data - diffify
- {rjd3jars} 0.0.4: External jars for ‘rjdverse’ R Packages - diffify
- {saqgetr} 0.2.24: Import Air Quality Monitoring Data in a Fast and Easy Way - diffify
- {reaborn} 1.0.1: Statistical Data Visualization, the ‘seaborn’ Way - diffify
- {mixor} 1.0.7: Mixed-Effects Ordinal Regression Analysis - diffify
- {lfl} 2.4.0: Linguistic Fuzzy Logic - diffify
- {gscramble} 1.0.2: Simulating Admixed Genotypes Without Replacement - diffify
- {geslaR} 1.0-3: Get and Manipulate the GESLA Dataset - diffify
- {DGEAR} 0.2.1: Differential Gene Expression Analysis with R - diffify
- {cohortBuilder} 1.0.0: Data Source Agnostic Filtering Tools - diffify
- {GRAB} 0.2.5: Genome-Wide Robust Analysis for Biobank Data (GRAB) - diffify
- {dtgiw} 1.1.0: Discrete Transmuted Generalized Inverse Weibull Distribution - diffify
- {CohortSurvival} 1.1.2: Estimate Survival from Common Data Model Cohorts - diffify
- {semanticfa} 0.1.1: Semantic Factor Analysis of Language Model Embeddings - diffify
- {RRPP} 2.2.0: Linear Model Evaluation with Randomized Residuals in a Permutation Procedure - diffify
- {GET} 1.0-8: Global Envelopes - diffify
- {GenOrd} 2.1.0: Simulation of Discrete Random Variables with Marginal Distributions and Correlation Matrix and via a Gaussian or Student’s t Copula - diffify
- {frontmatter} 0.3.0: Parse Front Matter from Documents - diffify
- {rerddap} 1.3.0: General Purpose Client for ‘ERDDAP™’ Servers - diffify
- {rdwd} 1.9.17: Select and Download Climate Data from ‘DWD’ (German Weather Service) - diffify
- {quantregForest} 1.4-0: Quantile Regression Forests - diffify
- {openalexR} 3.1.0: Getting Bibliographic Records from ‘OpenAlex’ Database Using ‘DSL’ API - diffify
- {modsem} 1.0.21: Latent Interaction (and Moderation) Analysis in Structural Equation Models (SEM) - diffify
- {gsDesign} 3.10.0: Group Sequential Design - diffify
- {ggseg} 2.2.1: Plotting Tool for Brain Atlases - diffify
- {DrugUtilisation} 1.2.1: Summarise Patient-Level Drug Utilisation in Data Mapped to the OMOP Common Data Model - diffify
- {ColombiAPI} 0.4.0: Access Colombian Data via APIs and Curated Datasets - diffify
- {ChileDataAPI} 0.3.0: Access Chilean Data via APIs and Curated Datasets - diffify
- {teal.modules.clinical} 0.13.0: ‘teal’ Modules for Standard Clinical Outputs - diffify
- {openxlsx2} 1.28: Read, Write and Edit ‘xlsx’ Files - diffify
- {neonUtilities} 4.0.1: Utilities for Working with NEON Data - diffify
- {dcortools} 0.2.0: Providing Fast and Flexible Functions for Distance Correlation Analysis - diffify
- {tidytree} 0.4.8: A Tidy Tool for Phylogenetic Tree Data Manipulation - diffify
- {teal.slice} 0.8.1: Filter Module for ‘teal’ Applications - diffify
- {mcptools} 1.0.0: Model Context Protocol Servers and Clients - diffify
- {ggpp} 0.6.1: Grammar Extensions to ‘ggplot2’ - diffify
- {ggfun} 0.2.1: Miscellaneous Functions for ‘ggplot2’ - diffify
- {csdata} 2026.7.2: Structural Data for Norway - diffify
- {Compind} 3.5: Composite Indicators Functions - diffify
- {circumplex} 1.2.0: Analysis and Visualization of Circular Data - diffify
- {BSL} 3.2.6: Bayesian Synthetic Likelihood - diffify
- {BrazilDataAPI} 0.3.0: Access Brazilian Data via APIs and Curated Datasets - diffify
- {arsenal} 3.7.1: An Arsenal of ‘R’ Functions for Large-Scale Statistical Summaries - diffify
- {VARcpDetectOnline} 0.2.1: Sequential Change Point Detection for High-Dimensional VAR Models - diffify
- {uaparserjs} 0.4.0: Parse ‘User-Agent’ Strings - diffify
- {shades} 1.5.0: Simple Colour Manipulation - diffify
- {scatterD3} 1.0.2: D3 JavaScript Scatterplot from R - diffify
- {RBesT} 1.10-0: R Bayesian Evidence Synthesis Tools - diffify
- {ratesci} 1.1.0: Confidence Intervals and Tests for Comparisons of Binomial Proportions or Poisson Rates - diffify
- {okf} 0.7.0: Open Knowledge Format (OKF) Ingestion - diffify
- {btw} 1.3.0: A Toolkit for Connecting R and Large Language Models - diffify
- {ggseg3d} 2.1.2: Interactive 3D Brain Atlas Visualization - diffify
- {SCEM} 1.2.0: Splitting-Coalescence-Estimation Method - diffify
- {metaboData} 0.6.4: Example Metabolomics Data Sets - diffify
- {EconGeo} 2.1: Computing Key Indicators of the Spatial Distribution of Economic Activities - diffify
- {harmonydata} 0.3.2: R Library for ‘Harmony’ - diffify
- {covercorr} 1.1.0: Coverage Correlation Coefficient and Testing for Independence - diffify
- {mlr3fda} 0.7.0: Extending ‘mlr3’ to Functional Data Analysis - diffify
- {clinicalomicsdbR} 1.0.6: Interface with the ‘ClinicalOmicsDB’ API, Allowing for Easy Data Downloading and Importing - diffify
- {BKP} 0.3.0: Beta Kernel Process Modeling - diffify
- {pdi} 0.4.3: Phenotypic Index Measures for Oak Decline Severity - diffify
- {okcolors} 0.1.2: A Set of Color Palettes Inspired by OK Go Music Videos for ‘ggplot2’ in R - diffify
- {netmhc2pan} 1.3.3: Interface to ‘NetMHCIIpan’ - diffify
- {metamer} 0.3.1: Create Data with Identical Statistics - diffify
- {ggperiodic} 1.0.4: Easy Plotting of Periodic Data with ‘ggplot2’ - diffify
- {finbif} 0.10.0: Interface for the ‘Finnish Biodiversity Information Facility’ API - diffify
- {faunabr} 1.1.0: Explore Catálogo Taxônomico da Fauna do Brasil Database - diffify
- {duckspatial} 1.2.0: R Interface to ‘DuckDB’ Database with Spatial Extension - diffify
- {brulee} 1.1.0: High-Level Modeling Functions with ‘torch’ - diffify
- {wideRhino} 1.2.0: High-Dimensional Methods via Generalised Singular Decomposition - diffify
- {robmixglm} 1.2-8: Robust Generalized Linear Models (GLM) using Mixtures - diffify
- {powerbrmsINLA} 1.3.0: Bayesian Power Analysis Using ‘brms’ and ‘INLA’ - diffify
- {OBIC} 4.3.0: Calculate the Open Bodem Index (OBI) Score - diffify
- {spdesign} 0.0.6: Designing Stated Preference Experiments - diffify
- {SPARTAAS} 1.2.6: Statistical Pattern Recognition and daTing using Archaeological Artefacts assemblageS - diffify
- {resmush} 1.0.2: Optimize and Compress Image Files with ‘reSmush.it’ - diffify
- {treeSS} 0.2.4: Tree-Spatial Scan Statistic for Cluster Detection - diffify
- {TemporalModelR} 0.3.0: Temporally Explicit Species Distribution Modelling - diffify
- {statease} 1.3.0: Simplified Statistical Analysis with Plain-English Interpretation - diffify
- {madrat} 3.37.1: May All Data be Reproducible and Transparent (MADRaT) * - diffify
- {llamaR} 0.2.5: Interface for Large Language Models via ‘llama.cpp’ - diffify
- {landmaRk} 0.1.3: Time-to-Event Landmark Analysis using an Array of Longitudinal and Survival Sub-Models - diffify
- {janusplot} 0.1.1: Asymmetric Smoothed-Association Matrices via GAM Fits - diffify
- {grmtree} 0.2.0: Recursive Partitioning for Graded Response Models - diffify
- {gatoRs} 2.0.0: Geographic and Taxonomic Occurrence R-Based Scrubbing - diffify
- {basifoR} 0.7.8: Retrieval and Processing of the Spanish National Forest Inventory - diffify
- {survkl} 1.0.2: Estimate Survival Data with Data Integration - diffify
- {RobinCar2} 0.2.3: ROBust INference for Covariate Adjustment in Randomized Clinical Trials - diffify
- {DSIR} 0.8.0: Data Science Infrastructure for Global Health - diffify
- {ChinAPIs} 0.2.0: Access Chinese Data via Public APIs and Curated Datasets - diffify
- {SVEMnet} 3.2.3: Self-Validated Ensemble Models with Lasso and Relaxed Elastic Net Regression - diffify
- {Rdrw} 1.0.3: Univariate and Multivariate Damped Random Walk Processes - diffify
- {DegreeDayCalc} 0.1.1: Degree-Day Phenology Calculator (‘shiny’ Application) - diffify
- {strollur} 0.1.3: Store and Transfer Amplicon Sequence Data - diffify
- {LifeTableFertility} 0.1.1: ‘shiny’ Application for Life Table and Fertility Analysis - diffify
- {LifeTableBuilder} 0.1.3: Interactive ‘shiny’ Application for Constructing Life Tables - diffify
- {FoRDM} 1.0.3: Forest Many-Objective Robust Decision Making (‘FoRDM’) - diffify
- {serad} 0.2.2: Standardized Economic Reporting and Automated Dynamic Writing / Synthèse d’Écrits Avec des Règles Automatisées et Dynamiques - diffify
- {phoenics} 0.6.1: Pathways Longitudinal and Differential Analysis in Metabolomics - diffify
- {normalize} 0.1.3: Centering and Scaling of Numeric Data - diffify
- {movegroup} 2026.07.01: Visualizing and Quantifying Space Use Data for Groups of Animals - diffify
- {MexicoDataAPI} 0.3.0: Access Mexican Data via APIs and Curated Datasets - diffify
- {asympDiag} 0.3.3: Diagnostic Tools for Asymptotic Theory - diffify
- {AIscreenR} 0.4.0: AI Screening Tools in R for Systematic Reviewing - diffify
- {a5R} 0.5.0: ‘A5’ Discrete Global Grid System - diffify
- {nanonext} 1.10.0: Lightweight Toolkit for Messaging, Concurrency and the Web - diffify
- {ife} 0.2.5: Autodiff for Influence Function Based Estimates - diffify
- {OUwie} 3.0.2: Analysis of Evolutionary Rates in an OU Framework - diffify
- {releaser} 1.2.0: Help with Preparing a New Version of an R Package - diffify
- {peopleanalyticsdata} 0.2.2: Data Sets for Keith McNulty’s Handbook of Regression Modeling in People Analytics - diffify
- {mlt} 1.8-1: Most Likely Transformations - diffify
- {ArchaeoPhases} 2.1.1: Post-Processing of Markov Chain Monte Carlo Simulations for Chronological Modelling - diffify
- {pharmaversesdtm} 1.5.0: SDTM Test Data for the ‘Pharmaverse’ Family of Packages - diffify
- {orthanc} 0.3.0: Programmatic Interface to ‘Orthanc’ DICOM Servers - diffify
- {OpenLand} 1.0.4: Quantitative Analysis and Visualization of LUCC - diffify
- {multiScaleR} 0.7.0: Methods for Optimizing Scales of Effect - diffify
- {gson} 0.2.0: Base Class and Methods for ‘gson’ Format - diffify
- {fastkqr} 1.0.1: A Fast Algorithm for Kernel Quantile Regression - diffify
- {enrichit} 0.2.0: ‘C++’ Implementations of Functional Enrichment Analysis - diffify
- {caretEnsemble} 4.0.2: Ensembles of Caret Models - diffify
- {jmotif} 1.3.0: Time Series Analysis Toolkit Based on Symbolic Aggregate Discretization, i.e. SAX - diffify
- {popEpi} 0.5.0: Functions for Epidemiological Analysis using Population Data - diffify
- {mets} 1.3.11: Analysis of Multivariate Event Times - diffify
- {structenforcement} 0.3.1: Struct-Like Data Type Checking and Enforcement - diffify
- {doBy} 4.7.2: Groupwise Statistics, LSmeans, Linear Estimates, Utilities - diffify
- {teal.modules.general} 0.7.0: General Modules for ‘teal’ Applications - diffify
- {surveillance} 1.26.0: Temporal and Spatio-Temporal Modeling and Monitoring of Epidemic Phenomena - diffify
- {statgenHTP} 1.0.9.3: High Throughput Phenotyping (HTP) Data Analysis - diffify
- {PRISMA2020} 1.1.4: Make Interactive ‘PRISMA’ Flow Diagrams - diffify
- {s20x} 3.3.0: Functions for University of Auckland Course STATS 201/208 Data Analysis - diffify
- {Rook} 1.2.1: HTTP Web Server for R - diffify
- {RMTstat} 0.3.2: Distributions, Statistics and Tests Derived from Random Matrix Theory - diffify
- {tinyVAST} 1.6.1: Multivariate Spatio-Temporal Models using Structural Equations - diffify
- {Slick} 1.0.2: Interactive Visualization of MSE Results - diffify
- {unvs.med} 1.1.1: A Universal Approach for Causal Mediation Analysis - diffify
- {gsDesign2} 1.1.9: Group Sequential Design with Non-Constant Effect - diffify
- {mwcsr} 0.1.12: Solvers for Maximum Weight Connected Subgraph Problem and Its Variants - diffify
- {SlimR} 1.1.6: Adaptive Machine Learning-Powered, Context-Matching Tool for Single-Cell and Spatial Transcriptomics Annotation - diffify
- {rATTAINS} 1.2.0: Access EPA ‘ATTAINS’ Data - diffify
- {portion} 0.1.3: Extracting a Data Portion - diffify
- {lmm} 1.5: Linear Mixed Models - diffify
- {Tplyr} 1.3.3: A Traceability Focused Grammar of Clinical Data Summary - diffify
- {tl} 0.0.2: Tiny Logging Interface to ‘rspdlite’ Wrapping ‘spdlite’ C++20 Logging - diffify
- {rchemo} 0.1-4: Dimension Reduction, Regression and Discrimination for Chemometrics - diffify
- {lsirm12pl} 2.0.3: Latent Space Item Response Model - diffify
- {lava} 1.9.2: Latent Variable Models - diffify
- {cicalc} 0.2.2: Calculate Confidence Intervals - diffify
- {limSolve} 2.0.3: Solving Linear Inverse Models - diffify
- {LBBNN} 0.1.6: Latent Binary Bayesian Neural Networks Using ‘torch’ - diffify
- {GeoModels} 2.2.5: Procedures for Gaussian and Non Gaussian Geostatistical (Large) Data Analysis - diffify
- {dvir} 3.4.2: Disaster Victim Identification - diffify
- {teal.widgets} 0.6.1: ‘shiny’ Widgets for ‘teal’ Applications - diffify
- {teal} 1.2.0: Exploratory Web Apps for Analyzing Clinical Trials Data - diffify
- {soilKey} 0.9.157: Automated Soil Profile Classification per WRB 2022, and USDA Soil Taxonomy 13 - diffify
- {seminrExtras} 1.0.2: Conduct Additional Modeling and Analysis for ‘seminr’ - diffify
- {ream} 1.0-12: Density, Distribution, and Sampling Functions for Evidence Accumulation Models - diffify
Videos and Podcasts
Shiny Apps
R Project Updates
Updates from R Core:
Upcoming Events in 3 Months
Events in 3 Months:
Connect
Join the Data Science Learning Community
rtistry
A little bit of generative art made with #RStats and @datawrapper.de #CreativeCoding
— Nicola Rennie (@nrennie.bsky.social) July 5, 2026 at 11:18 PM
[image or embed]
Quotes of the Week
UseR! 2026 (@user-conf.bsky.social ) Tutorial day kicking off at Warsaw University Of Technology #rstats
— Kevin Patrick O'Brien (@kobriendublin.bsky.social) July 6, 2026 at 9:22 AM
[image or embed]