Live
-
{{ is_pkg(link.U) }}{{ link.T }} {{ get_host(link.U) }} - {{ link.N }} ( {{ get_host(link.U) }} )
{{ is_pkg(link.U) }}{{ link.T }} {{ get_host(link.U) }}( {{ get_host(link.U) }} )
{{ item.date }}
-
{{ is_pkg(link.U) }}{{ link.T }} {{ get_host(link.U) }} - {{ link.N }}
( {{ get_host(link.U) }} ){{ is_pkg(link.U) }}{{ link.T }} {{ get_host(link.U) }}
( {{ get_host(link.U) }} )
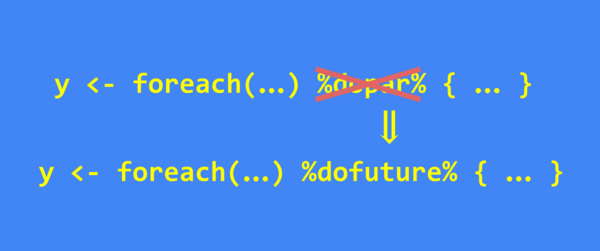
R Weekly 2023-W27 Targets validation workflow, %dofuture%, gmailr 2.0.0
This week’s release was curated by Sam Parmar, with help from the R Weekly team members and contributors.
Highlight
Insights


R in the Real World
Resources
-
r-help: R manual pages for previous versions of R from 0.60 onwards
-
A new function to plot convergence diagnostics from lme4::allFit()
New Packages
CRAN
- {countSTAR} 1.0.2: Flexible Modeling of Count Data
- {corrViz} 0.1.0: Visualise Correlations
- {restatis} 0.1.0: Web API Client for the German Federal Statistical Office Database
- {respR} 2.3.1: Import, Process, Analyse, and Calculate Rates from Respirometry Data
- {move2} 0.2.0: Processing and Analysing Animal Trajectories
- {hfhub} 0.1.0: Hugging Face Hub Interface
- {admiralvaccine} 0.1.0: Vaccine Extension Package for ADaM in ‘R’ Asset Library
- {tree3d} 0.1.2: 3D Tree Models
- {topChef} 0.1.0: Top Chef Data
GitHub or Bitbucket
Updated Packages
- {V8} 4.3.1: Embedded JavaScript and WebAssembly Engine for R - diffify
- {haven} 2.5.2: Import and Export ‘SPSS’, ‘Stata’ and ‘SAS’ Files - diffify
- {polite} 0.1.3: Be Nice on the Web - diffify
- {ggblanket} 3.0.0: Simplify ‘ggplot2’ Visualisation - diffify
- {openxlsx2} 0.7.1: Read, Write and Edit ‘xlsx’ Files - diffify
- {gmailr} 2.0.0: Access the ‘Gmail’ ‘RESTful’ API - diffify
- {prettifyAddins} 2.6.0: ‘RStudio’ Addins to Prettify ‘JavaScript’, ‘C++’, ‘Python’, and More - diffify
- {jsonlite} 1.8.7: A Simple and Robust JSON Parser and Generator for R - diffify
- {downlit} 0.4.3: Syntax Highlighting and Automatic Linking - diffify
- {odbc} 1.3.5: Connect to ODBC Compatible Databases (using the DBI Interface) - diffify
- {fusen} 0.5.1: Build a Package from Rmarkdown Files - diffify
- {rtoot} 0.3.2: Collecting and Analyzing Mastodon Data - diffify
- {ssh} 0.8.3: Secure Shell (SSH) Client for R - diffify
- {riskmetric} 0.2.2: Risk Metrics to Evaluating R Packages - diffify
- {tern} 0.8.4: Create Common TLGs Used in Clinical Trials - diffify
- {deps} 0.2.0: Dependency Management with ‘roxygen’-Style Comments - diffify
- {webshot} 0.5.5: Take Screenshots of Web Pages - diffify
- {targets} 1.2.0: Dynamic Function-Oriented ‘Make’-Like Declarative Pipelines - diffify
- {digest} 0.6.32: Create Compact Hash Digests of R Objects - diffify
- {crew} 0.3.0: A Distributed Worker Launcher Framework - diffify
- {pkgbuild} 1.4.2: Find Tools Needed to Build R Packages - diffify
- {askgpt} 0.1.2: Asking GPT About R Stuff - diffify
- {mirai} 0.9.0: Minimalist Async Evaluation Framework for R - diffify
Videos and Podcasts
Shiny Apps
R Internationally
Tutorials

R Project Updates
Updates from R Core:
Call for Participation
Upcoming Events in 3 Months
Events in 3 Months:


Jobs
💼 Explore Jobs & Gigs Board on RStudio Community 💼
rtistry
On the data visualisation 📊 to generative art 🎨 spectrum, I think this one sits right in the middle!
— Nicola Rennie | @[email protected] (@nrennie35) June 29, 2023
Can you guess what the underlying data is?#RStats #DataViz #Rtistry #GenArtClub pic.twitter.com/NIYaiADykO
Today's artwork generated with #rstats and #ggplot2: pic.twitter.com/6XAzubNexp
— aRtsy package (@aRtsy_package) July 2, 2023
#runeverystreet in #WestVan (and #NorthVan) ... today was Caulfield neighborhood in West Vancouver. Plotted using #Strava data in #Rstats using the amazing #rayshader and #rayvista packages! pic.twitter.com/edddPyns87
— Michael Hainke (@MichaelHainke) June 28, 2023
Quotes of the Week
A little while ago I teased a video of #webR running #rstats Shinylive apps entirely in the browser with #wasm. We're working on it, but for the moment I've setup a repo with some technical info about how this all works, targeted at brave JavaScript devs https://t.co/tzD2eNGoLH https://t.co/2UXY7YYYPm
— George Stagg (@gwstagg) June 30, 2023