Live
-
{{ is_pkg(link.U) }}{{ link.T }} {{ get_host(link.U) }} - {{ link.N }} ( {{ get_host(link.U) }} )
{{ is_pkg(link.U) }}{{ link.T }} {{ get_host(link.U) }}( {{ get_host(link.U) }} )
{{ item.date }}
-
{{ is_pkg(link.U) }}{{ link.T }} {{ get_host(link.U) }} - {{ link.N }}
( {{ get_host(link.U) }} ){{ is_pkg(link.U) }}{{ link.T }} {{ get_host(link.U) }}
( {{ get_host(link.U) }} )
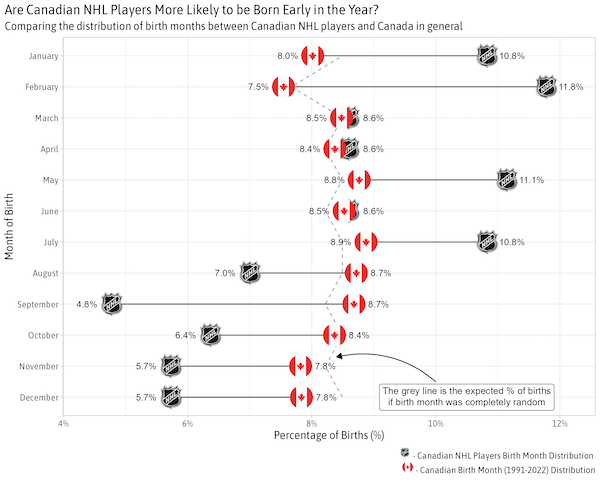
R Weekly 2023-W50 NHL Birth Dates, Quarto Dashboards, View
This week’s release was curated by Jon Calder, with help from the R Weekly team members and contributors.
Highlight
Insights
R in the Real World
R in Organizations
Resources
New Packages
CRAN
-
{rgeoboundaries} 1.2.9: A Client to ‘geoBoundaries’, a Political Administrative Boundaries Dataset
-
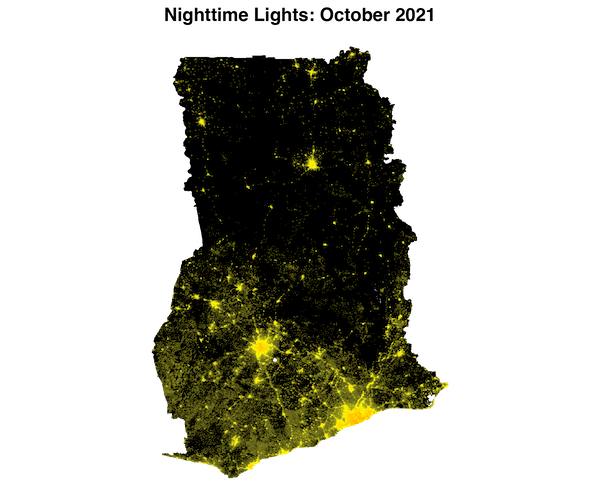
{blackmarbler} 0.1.0: Black Marble Data and Statistics
-
{FjordLight} 0.7.0: Available Light Within the Water Column and Seafloor of Arctic Fjords
-
{nexus} 0.1.0: Sourcing Archaeological Materials by Chemical Composition
Updated Packages
-
{tabnet} 0.5.0: Fit ‘TabNet’ Models for Classification and Regression - diffify
-
{nanonext} 0.11.0: NNG (Nanomsg Next Gen) Lightweight Messaging Library - diffify
-
{mirai} 0.11.3: Minimalist Async Evaluation Framework for R - diffify
-
{mirai.promises} 0.4.1: Make ‘Mirai’ ‘Promises’ - diffify
-
{ichimoku} 1.4.11: Visualization and Tools for Ichimoku Kinko Hyo Strategies - diffify
-
{DT} 0.31: A Wrapper of the JavaScript Library ‘DataTables’ - diffify
-
{mizer} 2.5.0: Dynamic Multi-Species Size Spectrum Modelling - diffify
Videos and Podcasts
Gist & Cookbook
Tutorials
-
What is the probability that two persons have the same initials?
-
{checkhelper} is on CRAN: so you don’t have to be afraid to run a check
-
How Does a Compound Symmetric Correlation Structure Translate to a Markov Model?
R Project Updates
Updates from R Core:
Upcoming Events in 3 Months
Events in 3 Months:
Jobs
💼 Explore Jobs & Gigs Board on RStudio Community 💼
rtistry
Life Expectancy for this week's #TidyTuesday challenge.
— Nikolaos Pechlivanis (@npechl) December 7, 2023
R code: https://t.co/OlGgPysrS2
source: @OurWorldInData#rstats #dataviz pic.twitter.com/2s9QE2cGFv
The prompt "R syntax to plot a christmas tree decorated with tinsel and baubles, with the R symbol on the top, using ggplot"
— Luke Pilling (@lcpilling) December 4, 2023
The plot...#ChatGPT #AIfail #rstats #art #Christmas pic.twitter.com/xGAwNtWGQz
Quotes of the Week
Which model do I need for which outcome? An overview of R packages: https://t.co/nqVYsT7RX5
— Daniel 🤎🤍❤️ (@strengejacke) December 8, 2023
Comments, additions, corrections, ... appreciated #rstats
What stresses me out isn’t the same thing that stressed my parents out.
— Matt Dancho (Business Science) (@mdancho84) December 7, 2023
True story. 🧵 #DataScience #Rstats pic.twitter.com/KRXDSaDCAg