Live
-
{{ is_pkg(link.U) }}{{ link.T }} {{ get_host(link.U) }} - {{ link.N }} ( {{ get_host(link.U) }} )
{{ is_pkg(link.U) }}{{ link.T }} {{ get_host(link.U) }}( {{ get_host(link.U) }} )
{{ item.date }}
-
{{ is_pkg(link.U) }}{{ link.T }} {{ get_host(link.U) }} - {{ link.N }}
( {{ get_host(link.U) }} ){{ is_pkg(link.U) }}{{ link.T }} {{ get_host(link.U) }}
( {{ get_host(link.U) }} )
R Weekly 2022-W17 CSV, GLMM, NSE
This week’s release was curated by Jonathan Carroll, with help from the RWeekly team members and contributors.
Highlight
-
Loading a large, messy csv using data.table fread with cli tools
-
Not so standard evaluations - Getting a better understanding of the tidyeval framework
-
Listen to the R-Weekly Highlights podcast episode 75
Insights

-
RObservations #30: Fixing R’s “messy string concatenation” with a special function
-
Loading a large, messy csv using data.table fread with cli tools
-
Not so standard evaluations - Getting a better understanding of the tidyeval framework

-
How to create your own functions in R - Putting the FUN in functions!
-
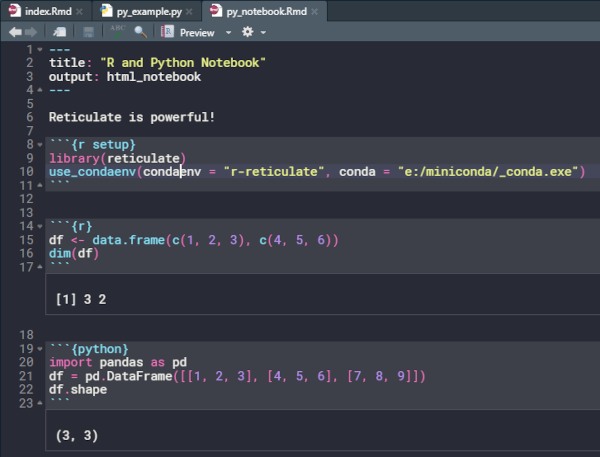
Linking R and Python to retrieve financial data and plot a candlestick
-
MLDataR - Real-world Datasets for Machine Learning Applications
R in Organizations

Resources
New Packages
CRAN
GitHub or Bitbucket
- {designer} 0.0.0.9000: ‘Shiny’ application UI drag-and-drop helper.
Updated Packages
- {seasonal} 1.9: Accessing composite output
- {matrixStats} 0.62.0: Functions that Apply to Rows and Columns of Matrices (and to Vectors)
- New features in {overviewR}
- parallelly 1.31.1: Better at Inferring Number of CPU Cores with Cgroups and Linux Containers
- {parallelly} 1.31.1: Enhancing the ‘parallel’ Package
- {future} 1.25.0: Unified Parallel and Distributed Processing in R for Everyone
- {lambdr} 1.2.0: Create a Runtime for Serving Containerised R Functions on AWS Lambda.
- {ftExtra} 0.4.0: Extensions for ‘Flextable’.
- {ggtrace} 0.5.1: Programmatically explore, debug, and manipulate ggplot internals
Tutorials
R Project Updates
Updates from R Core:
Upcoming Events in 3 Months
Events in 3 Months:
-
Tidy Survey Analysis in R: Workshop Series: April 15th, April 22nd, April 29th
-
Big Data Belfast: May 25th
-
UseR! (Online): June 20th-23rd
-
Rstudio::Conf: July 25th-28th
Grants & Funding
-
R Consortium ISC Call for Proposals looking to provide grants for technical projects that will have a significant impact on the R Community. Deadline 2022-05-01
-
R Consortium New R User Groups, Conferences, and Training Program. Deadline 2022-09-30
Datasets
Jobs
- Data Analyst (Part-time): Upfront
Call for Participation
Quotes of the Week
It's a wrap! I enjoyed a lot curating for @WeAreRLadies this week covering different topics. You may have noticed, but I highlighted some #rstats pkgs made in 🇦🇺 so you can see wonderful works in this land of 🦘🐨🪃 -- I may be biased, we're a great bunch & worth the visit 💼😁 https://t.co/LPj1HSovN3 pic.twitter.com/SyrckDFvhN
— Emi Tanaka (田中愛美) 💉💉💉 (@statsgen) April 23, 2022
Got 3D and music working for #rstats and #raylib!
— Jeroen Janssens (@jeroenhjanssens) April 20, 2022
Up next: keyboard and mouse interactivity. pic.twitter.com/GuveB0HSwX
I couldn't resist getting in on the fun, updated for R >= 4.1, created using {gt}! h/t @skyetetra #rstats #tidyverse #magrittr #alignmentchart
— Isabella Velásquez (@ivelasq3) June 15, 2021
Repo here: https://t.co/gjGWLKYYG5 pic.twitter.com/1Ez6eQKkGd