Live
-
{{ is_pkg(link.U) }}{{ link.T }} {{ get_host(link.U) }} - {{ link.N }} ( {{ get_host(link.U) }} )
{{ is_pkg(link.U) }}{{ link.T }} {{ get_host(link.U) }}( {{ get_host(link.U) }} )
{{ item.date }}
-
{{ is_pkg(link.U) }}{{ link.T }} {{ get_host(link.U) }} - {{ link.N }}
( {{ get_host(link.U) }} ){{ is_pkg(link.U) }}{{ link.T }} {{ get_host(link.U) }}
( {{ get_host(link.U) }} )
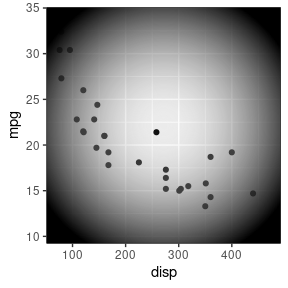
R Weekly 2021-W23 Reusing chunk options, VSCode-R 2021, hello {gggrid}
This week’s release was curated by Miles McBain, with help from the R Weekly team members and contributors.
Highlight
Insights
-
Building your own knitr compile farm on your Raspberry Pi with {plumber}
-
Don’t Know Which LaTeX Package(s) to Install When Getting a LaTeX Error?
-
Sample size determination in the context of Bayesian analysis
R in the Real World
R in Academia
Resources
New Packages
CRAN
-
{sparseGAM} 1.0: Sparse Generalized Additive Models
-
{additive} 0.0.1: Bindings for Generalized Additive Models (GAM)
-
{icecream} 0.1.1: Print Debugging Made Sweeter
-
{valse} 0.1-0: Variable Selection with Mixture of Models
-
{flipbookr} 0.1.0: Parses Code, Creates Partial Code Builds, Delivers Code Movie
-
{sitsfeats} 0.0.1: Satellite Image Time Series Features
GitHub or Bitbucket
Updated Packages
Videos and Podcasts
Shiny Apps
R Internationally
Tutorials
-
An ELT from scratch with {googleCloudRunner}, Docker, Google Cloud Platform and R
-
Mind the Gap – Safely Incorporating Deep Learning Models into the Actuarial Toolkit
-
Simulated Neural Network with Bootstrapping Time Series Data
R Project Updates
Updates from R Core:
Upcoming Events in 3 Months
Events in 3 Months:
Jobs
Call for Participation
Rtistry
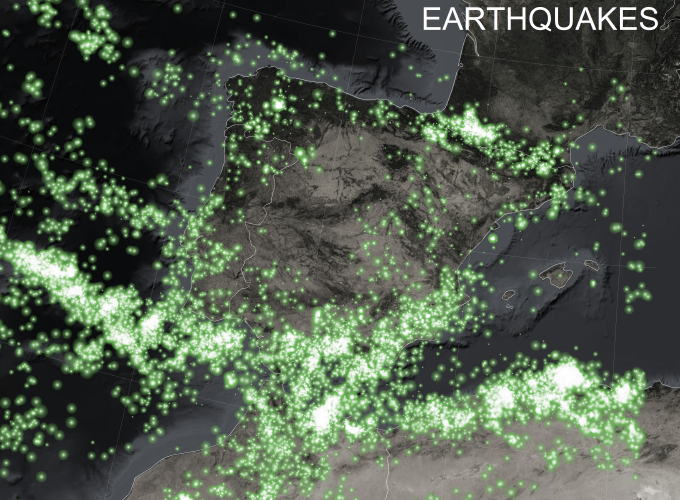
I have revisited lighthouse data from @openstreetmap that I used last year in the #30DayMapChallenge, and now I have given it a touch of firefly cartographic style. #rstats #rspatial
— Dominic Royé (@dr_xeo) June 5, 2021
Here more details in my recent blog post https://t.co/ntRCbzxeA0 pic.twitter.com/soIUBQCbrm
Late submission for last week's #tidytuesday. Used my favorite tt of 2020 as inspiration (@CedScherer https://t.co/QmQDat2794) to make a Rainbow Road plot of cumulative days holding Mario Kart 64 records by players.
— data_warz (@TWarczak) June 3, 2021
code: https://t.co/cBlW7TbrxU#dataviz #rstats pic.twitter.com/A2s8sdqNja
Quotes of the Week
Introducing #RecreationThursday! Every two weeks, we'll be sharing a piece of art for #dataviz folks to recreate/remix and get those creative juices flowing🎨
— Natalie O'Shea (@_natalie_oshea) June 3, 2021
🧵(thread for more info!) pic.twitter.com/2ztqRoiZYT
This already been done? #tidyverse #rstats pic.twitter.com/P8CbDQICtl
— Tyson Barrett ✊ (@healthandstats) June 1, 2021
Where chess pieces go to die: I analyzed 15000 chess games to see where each individual piece tend to be captured. #dataviz #RStats pic.twitter.com/qtzUbN6eZg
— Anders Sundell (@sundellviz) May 30, 2021