Live
-
{{ is_pkg(link.U) }}{{ link.T }} {{ get_host(link.U) }} - {{ link.N }} ( {{ get_host(link.U) }} )
{{ is_pkg(link.U) }}{{ link.T }} {{ get_host(link.U) }}( {{ get_host(link.U) }} )
{{ item.date }}
-
{{ is_pkg(link.U) }}{{ link.T }} {{ get_host(link.U) }} - {{ link.N }}
( {{ get_host(link.U) }} ){{ is_pkg(link.U) }}{{ link.T }} {{ get_host(link.U) }}
( {{ get_host(link.U) }} )
R Weekly 2021-W28
This week’s release was curated by Batool Almarzouq, with help from the R Weekly team members and contributors.
Highlight
-
{fusen} 0.2.2: Build a Package from R Markdown File
Insights
R in the Real World
Resources
New Packages
CRAN
- {fusen} 0.2.2: Build a Package from Rmarkdown File

-
{r02pro} 0.1: R Programming: Zero to Pro
-
{figpatch} 0.1.0.1: Easily Arrange External Figures with Patchwork Alongside ‘ggplot2’ Figures
-
{VancouvR} 0.1.6: Access the ‘City of Vancouver’ Open Data API
-
{twoxtwo} 0.1.0: Work with Two-by-Two Tables
-
{SeqNet} 1.1.3: Generate RNA-Seq Data from Gene-Gene Association Networks
-
{Rage} 1.1.0: Life History Metrics from Matrix Population Models
-
{NMdata} 0.0.8: Preparation, Checking and Post-Processing Data for PK/PD Modeling
-
{maat} 1.0.2: Multiple Administrations Adaptive Testing
-
{geovol} 1.0: Geopolitical Volatility (GEOVOL) Modelling
-
{dedupewider} 0.0.1: Deduplication Across Multiple Columns
Updated Packages
-
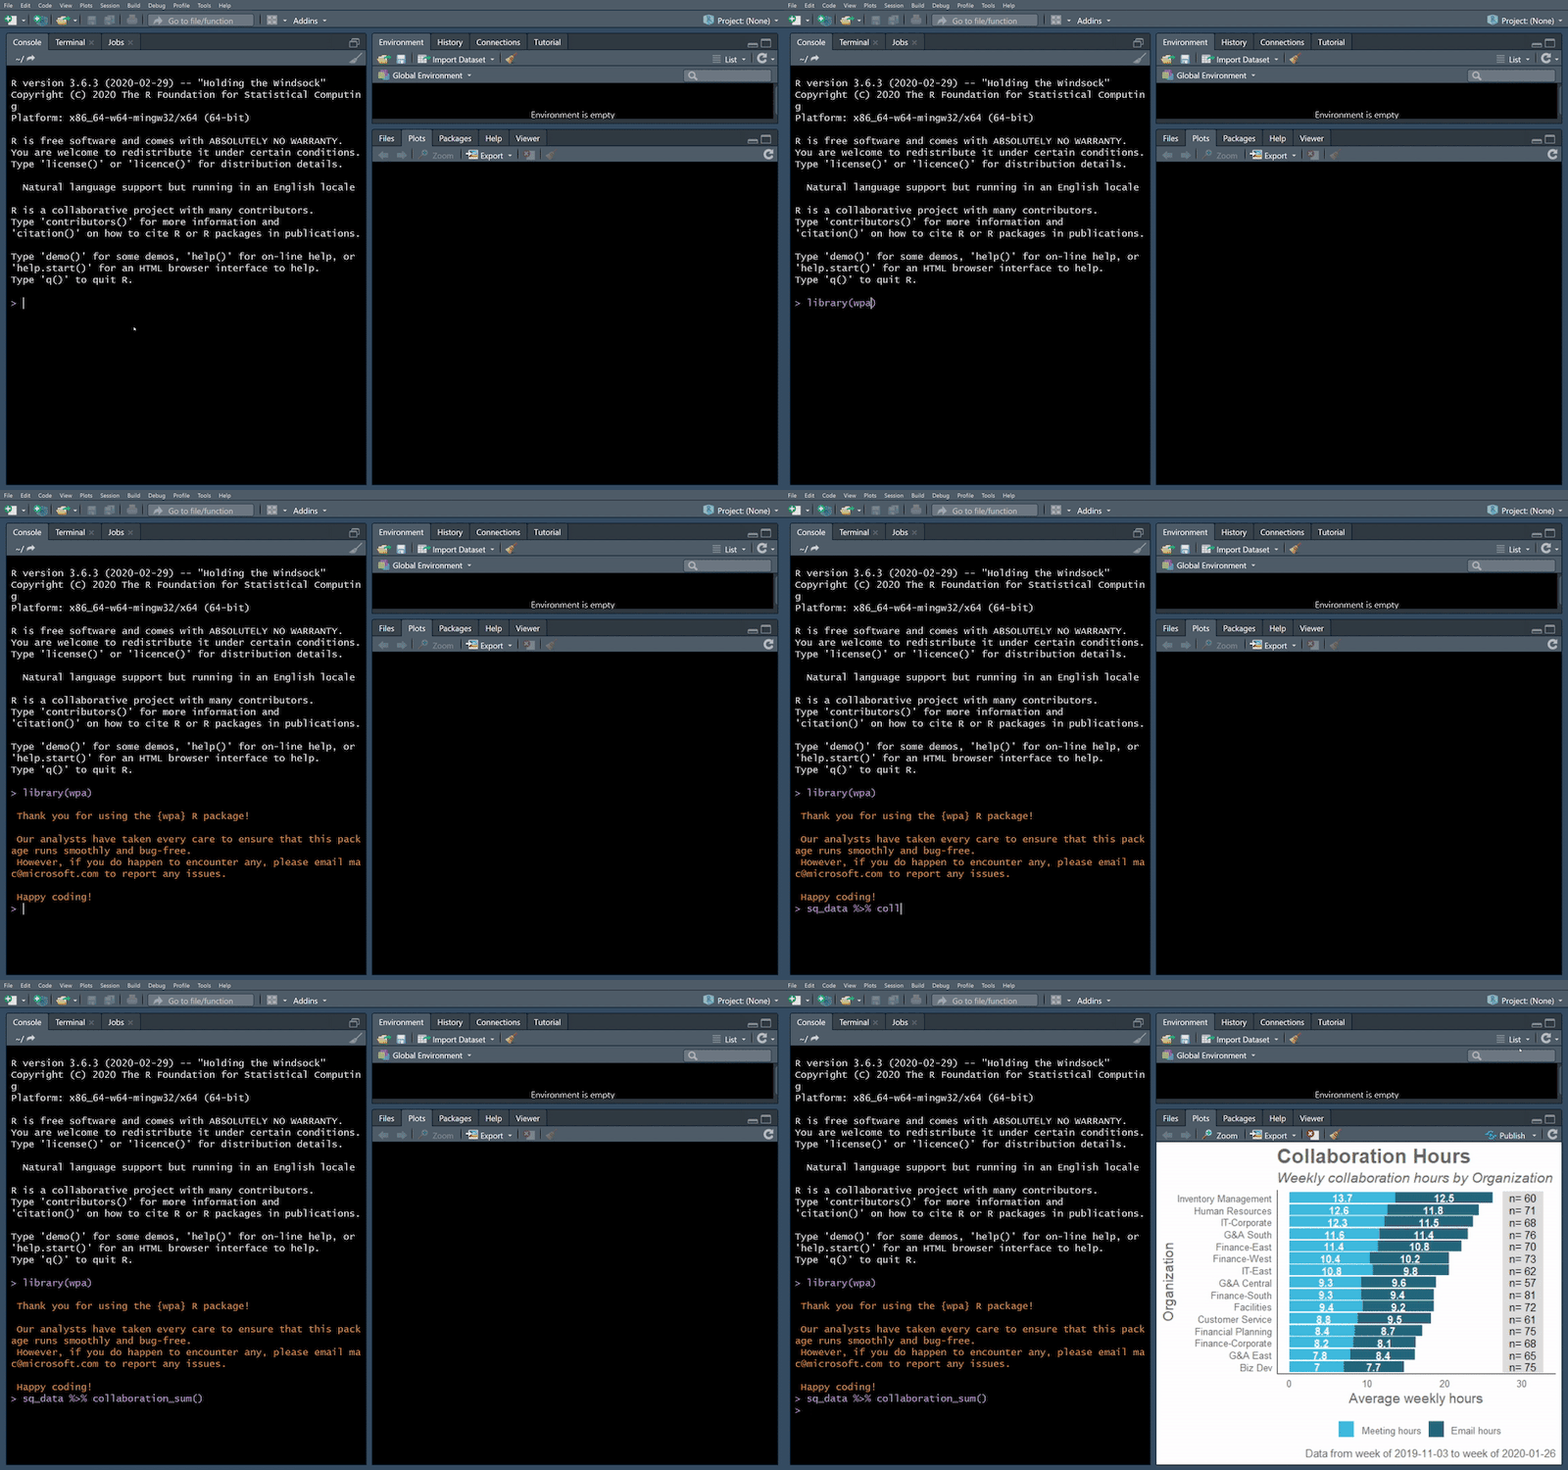
{wpa} 1.6.0: Tools for Analysing and Visualising Data from Workplace Analytics

Videos and Podcasts
-
Setting the foundation for your OBS Studio setup: Eric Nantz shares best practices and tips for setting up OBS Studio for success in producing video content showcasing R analyses.
Shiny Apps

Tutorials


R Project Updates
Updates from R Core:
Upcoming Events in 3 Months
Events in 3 Months:
Call for Participation
Quotes of the Week
Big thank you to the whole @_useRconf team for a great #useR2021!
— Achim Zeileis (@AchimZeileis) July 11, 2021
I remember when the Zurich team had to decide whether to go hybrid (ie w/ 2 "classes" of participants) or fully online to turn it into the most international, diverse, and inclusive useR! ever.
And WOW they did! pic.twitter.com/Ws5Dynlsse
#rstats @_useRconf #a11y the people here carefully followed the conference’s accessibility guidelines for their slides. Many of them were using rmarkdown/Xaringan for the first time!
— Liz Hare PhD @ UseR! 2021 (@DogGeneticsLLC) July 10, 2021
Please do use their work as examples when you try to improve your presentations! https://t.co/MxJ8Wvmk6w
{“mode”:”full”,”isActive”:false}