Live
-
{{ is_pkg(link.U) }}{{ link.T }} {{ get_host(link.U) }} - {{ link.N }} ( {{ get_host(link.U) }} )
{{ is_pkg(link.U) }}{{ link.T }} {{ get_host(link.U) }}( {{ get_host(link.U) }} )
{{ item.date }}
-
{{ is_pkg(link.U) }}{{ link.T }} {{ get_host(link.U) }} - {{ link.N }}
( {{ get_host(link.U) }} ){{ is_pkg(link.U) }}{{ link.T }} {{ get_host(link.U) }}
( {{ get_host(link.U) }} )
R Weekly 2021-21 R 4.1.0 and the native pipe, package documentation, evolution of a ggplot
This week’s release was curated by Kelly Bodwin, with help from the R Weekly team members and contributors.
Highlight

Insights

R in the Real World
R in Organizations
R in Academia
Resources

New Packages
CRAN
-
ichimoku 0.1.2 Ichimoku Kinko Hyo cloud charts for technical analysis.
-
{ggseg} 1.6.3: Plotting Tool for Brain Atlases.
-
{spectre} 1.0.0: Predict Regional Community Composition
-
{eff2} 1.0.0: Efficient Least Squares for Total Causal Effects
-
{particle.swarm.optimisation} 1.0: Optimisation with Particle Swarm Optimisation
-
{dialectR} 1.0: Doing Dialectometry in R
-
{SimplyAgree} 0.0.2: Flexible and Robust Agreement and Reliability Analyses
-
{frenchdata} 0.1.1: Download Data Sets from Kenneth’s French Finance Data Library Site
-
{contact} 1.2.8: Creating Contact and Social Networks
-
{wacolors} 0.2.1: Colorblind-Friendly Palettes from Washington State
-
{autocart} 1.4.4: Autocorrelation Regression Trees
BioC
GitHub or Bitbucket

Updated Packages
-
{tidycensus}: Load US Census boundary and attribute data as ‘tidyverse’ and ‘sf’-ready data frames in R.
-
{SPOT} 2.5.0: Sequential Parameter Optimization Toolbox
-
{plot3D} 1.4: Plotting Multi-Dimensional Data
-
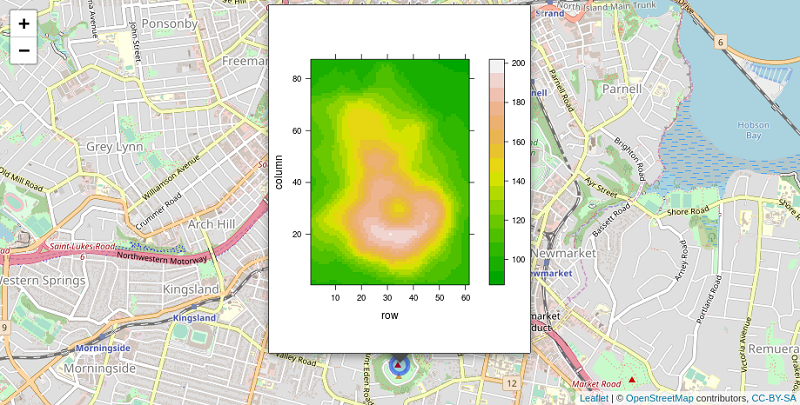
{leafpop} 0.1.0: Include Tables, Images and Graphs in Leaflet Pop-Ups

- {pkglite} 0.2.0: Compact Package Representations
Videos and Podcasts
-
R 4.1.0: Base R Pipe Has Arrived! Use Cases, Benchmark vs. magrittr
-
Progress Bars and Parallel Execution in R: progressr and future
Gist & Cookbook
Shiny Apps
-
{FielDHub} 0.1.0: A Shiny App for Design of Experiments in Life Sciences
R Internationally
Tutorials

R Project Updates
Updates from R Core:
Upcoming Events in 3 Months
Events in 3 Months:
-
R Lille Meetup: “Reproducible Computation at Scale in R with {targets}”
-
Learning Lab: Time Series Forecasting in Production (May 26)
Datasets
- {frenchdata} 0.1.1: Download Data Sets from Kenneth’s French Finance Data Library Site
Jobs
Call for Participation
Rtistry
Step outside, summertime's in bloom#rstats #maths #rtistry #generative pic.twitter.com/QT8ZqbwUYV
— Antonio Sánchez Chinchón (@aschinchon) May 22, 2021
First part of Folding Flow on @hicetnunc2000
— Thomas Lin Pedersen (@thomasp85) May 18, 2021
Purple 1/1: https://t.co/Sx0wm9YQjB
Red 1/1: https://t.co/jG1CCf3bVH
Blue 1/1: https://t.co/52KjL00lzq
Green 10/10: https://t.co/hqNKSZiDms#generative #cryptoart #hicetnunc #CleanNFTs #NFTs #creativecoding pic.twitter.com/rrnCgmOaBo
#RStats #rtistry I should fix this but need out of brain pic.twitter.com/NNABPNZbGP
— Dan Miller (@data_nurse) May 17, 2021
A chaotic mandala made with one point for every person on Earth. Full resolution image is here: https://t.co/o3JguTSqZD. #mathart #maydala #attractor #rtistry. pic.twitter.com/yGNbDGmzsD
— George Savva (@georgemsavva) May 16, 2021
Quotes of the Week
May the pipe wars begin #RStats pic.twitter.com/nyGxEvRukq
— Christopher McMaster (@DrCMcMaster) May 19, 2021
All of the die hards rn#rstats pic.twitter.com/kFv7PCAjn0
— Chad C Williams (@WilliamsNeuro) May 21, 2021
"5 hours of debugging can save you 5 minutes of reading documentation"- experienced programmers#RStats #programming pic.twitter.com/VcEWDn8bYU
— #RStats Question A Day (@data_question) May 21, 2021