R Weekly 2021-W27
This week’s release was curated by Jon Calder, with help from the R Weekly team members and contributors.
Highlight
Insights
R in the Real World

New Packages
CRAN
-
{archive} 1.0.0: Multi-Format Archive and Compression Support
-
{potools} 0.2.0: Tools for Internationalization and Portability in R Packages
-
{rgoogleads} 0.1.1: Loading Data from ‘Google Ads API’
-
{swissdd} 1.1.3: Get Swiss Federal and Cantonal Vote Results from Opendata.swiss
Updated Packages
-
{gargle} 1.2.0: Utilities for Working with Google APIs
-
{libr} 1.2.0: Libraries, Data Dictionaries, and a Data Step for R
-
{metathis} 1.1.1: HTML Metadata Tags for ‘R Markdown’ and ‘Shiny’
-
{qrcode} 0.1.3: Generate QRcodes with R
-
{samc} 1.4.0: Spatial Absorbing Markov Chains
-
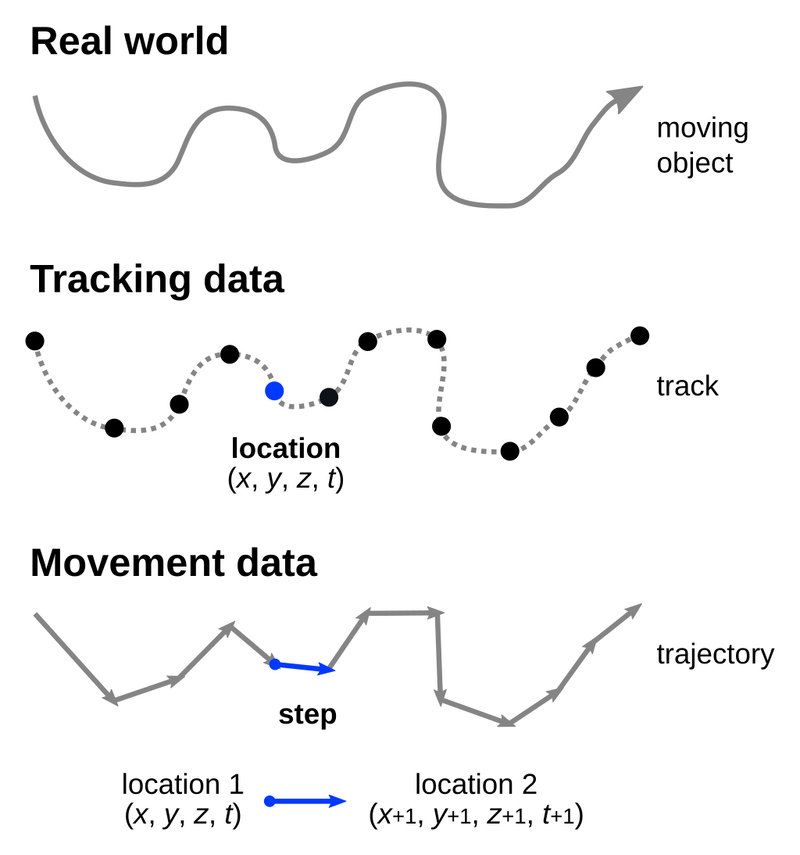
{sftrack} 0.5.3: Modern Classes for Tracking and Movement Data

-
{shinyvalidate} 0.1.1: Input Validation for Shiny Apps
-
{vapour} 0.6.5: Lightweight Access to the ‘Geospatial Data Abstraction Library’ (‘GDAL’)
Videos and Podcasts
Tutorials

-
How to Create a Violin plot in R with ggplot2 and Customize it
-
Create a custom metric with tidymodels and NYC Airbnb prices
R Project Updates
Updates from R Core:
Upcoming Events in 3 Months
Events in 3 Months:
Call for Participation
Quotes of the Week
Mind blown. Not only does GitHub copilot "know" R syntax, it also "knows" how to do data analysis. #rstats pic.twitter.com/iG8k2jvYDF
— David Smith (@revodavid) July 1, 2021
🧵 Daily maximum temperatures in #Portland from 1938–2021, colored by year.
— Cédric Scherer 💉 (@CedScherer) June 30, 2021
Inspired by @nytimes and comments on their #dataviz, here are some charts illustrating the severe #HeatWave2021 🌡️ that currently shatters #USA and #Canada.
Created💯% in #rstats and #ggplot2. (1/7) pic.twitter.com/mP6BCU5oJ0